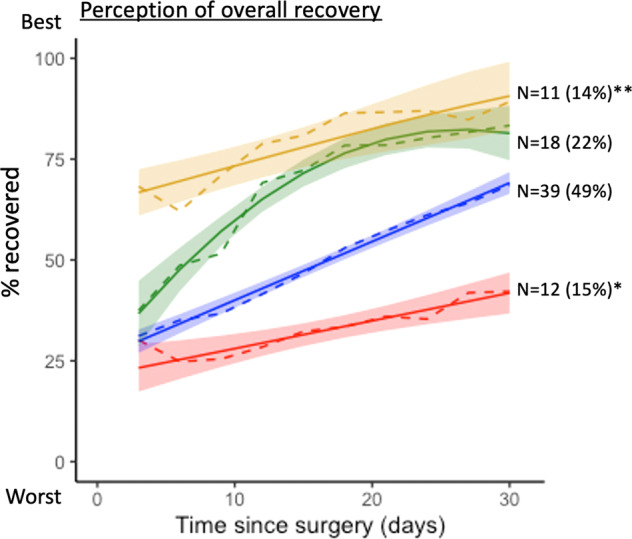
Fig. 1. Trajectories of patient perception of overall recovery.

The figure shows four trajectories of overall recovery on the patient-reported scale of 0 to 100%. The trajectory groups were identified by fitting the group-based trajectory model. The yellow curve depicts the best recovery trajectory, including 11 patients, and the red curve depicts the worst recovery trajectory, including 12 patients. Trajectory with a single asterisk (*) denotes the worst recovery trajectory and the trajectory with double asterisks (**) denotes the best trajectory.
