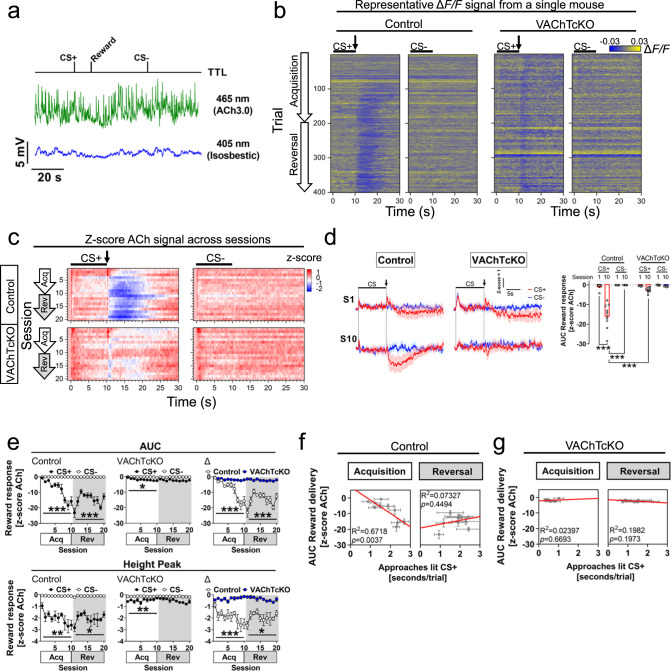
Fig. 4. Deficits in acetylcholine release from cholinergic interneurons underlie impaired approach behaviours to reward-predicting stimuli.
a Representative fibre photometry recording from a control littermate mouse showing raw fluorescence signal at 465nm (green, ACh3.0) and isosbestic 405nm (blue). A TTL input signal was used to time-lock CS onset and reward delivery. b Representative trial-by-trial heatmaps showing nucleus accumbens ACh dynamics (ΔF/F) from a control littermate and VAChTcKO mouse performing the Autoshaping task (Session 1→10, acquisition: trials 1→200; Session 11→20, reversal: trials 201→400). Bar indicates CS presentation (10 s), arrow bar shows reward delivery. c Heatmaps illustrating trial average ACh dynamics (z-score) across acquisition (Acq, S1→S10) and reversal (Rev, S11→S20) sessions (CS+, left panels; CS-, right panels). Bar indicates CS presentation (10 s) and arrow bar reward delivery. d (left) Trial average of CS+ (red) and CS- (blue) ACh recordings during acquisition sessions (S1, S10) in control littermate and VAChTcKO mice. Bar indicates CS presentation (10s), arrow bar indicates reward delivery. (right) Area under the curve (AUC) of ACh signal (z-score) after CS+ offset (reward delivery) and CS- offset. In contrast to the first training session (S1), The ACh signal significantly reduced in trained control mice (S10), but VAChTcKO (one-way ANOVA, F(7,52) = 30.31, p < 0.0001). e (Top panels) AUC of ACh signal after CS offset (CS+, reward delivery - filled circles; CS-, no reward - blank circles) across sessions in control (top-left panel, two-way RM-ANOVA SessionXCS, Acq: F(9,108) = 18.43, p < 0.0001; Rev: F(9,108) = 8.338, p < 0.0001), VAChTcKO (top-middle panel, Acq: F(9,126) = 2.527, p = 0.0107; Rev: p > 0.05), and relative (Δ) AUC differences between genotypes (top-right panel, Acq: F(9,117) = 16.61, p < 0.0001; Rev: F(9,117) = 8.878, p < 0.0001). (bottom panels) Height peak of ACh signal in control mice (bottom-left, two-way RM-ANOVA SessionXCS, Acq: F(9,108) = 4.091, p = 0.0002; Rev: F(9,108) = 2.491, p = 0.0126) and VAChTcKO mice (bottom-middle, Acq: F(9,126) = 3.426, p = 0.0008; Rev: p > 0.05). The relative (Δ) amplitude of events were larger in control than VAChTcKO mice across sessions (bottom-right, Acq: F(9,117) = 5.438, p < 0.0001; Rev: F(9,117) = 2.450, p = 0.0136). f Correlation analysis between the ACh AUC signal during reward delivery and time control mice spent approaching lit CS+. g Correlation analysis between ACh response during reward delivery and time VAChTcKO mice approached lit CS+. At least otherwise indicated, a total of N = 7 (n = 4♂, n = 3♀) control littermate mice and N = 8 (n = 4♂, n = 4♀) VAChTcKO mice were used. Post-hoc Tukey’s test: ***p < 0.0001, **p < 0.001, *p < 0.05. No adjustments were made for multiple comparison analyses. Data are presented as the mean ± SEM.

