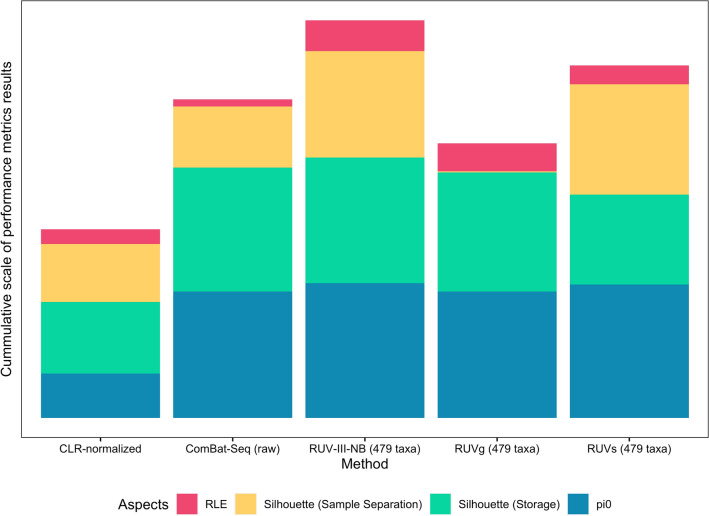
Figure 4.
Summarized plot showing the performances of all the methods used to remove unwanted variations in pig faecal samples. For methods utilizing control features (RUVg, RUVs, and RUV-III-NB), we only picked the attempts using combination control taxa (479 taxa) as they demonstrated overall best performances within each method. For every method represented by the stacked bar, each color represents the performance of each method in each specific metric (as previously shown in Fig. 3); for visual uniformity, a taller stacked bar represents overall better performance. For RLE, the value represented was taken from 1-overall canonical correlation of the RLE metrics and known unwanted technical variations; for silhouette (storage), the value was taken from 1- average width of silhouette statistics score for clustering by storage conditions.

