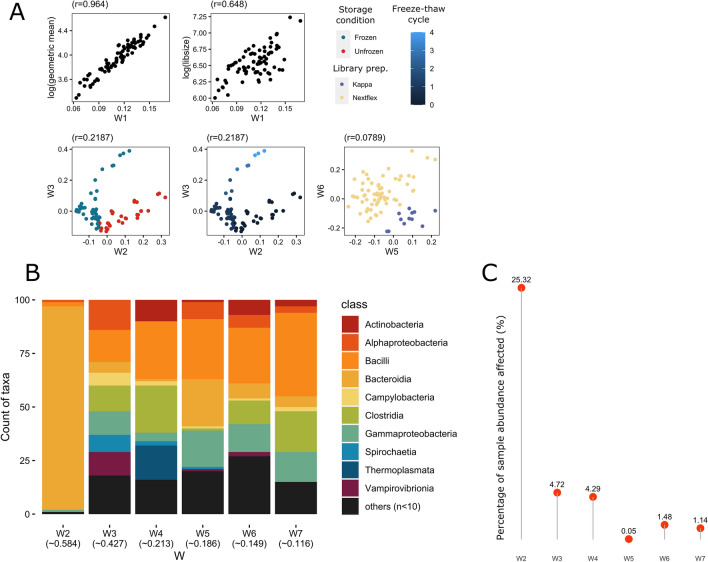
Figure 5.
(A) Factors of estimated unwanted variations (Ws) from RUV-III-NB correlated with known batch information: unwanted factor 1 (W1) correlated with log library size and log geometric mean, W2 correlated with storage conditions, W3 correlated with freeze–thaw cycles, and both W4 & W5 correlated with library preparation kits. (B) The top 100 microbial taxa most affected by each W colored by Class, ranked based on Veall-Zimmermann pseudo R-squared (mean listed under every W). Classes with less than two microbial taxa were merged as “others”. (C) The proportion of a sample’s total abundance affected by the top 100 microbial taxa for each W.

