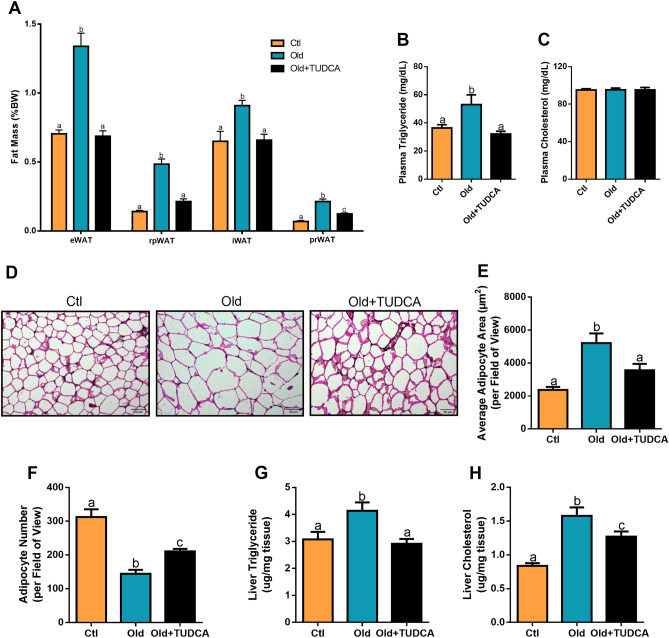
Figure 2.
Effects of TUDCA treatment upon fat depots and liver lipids accumulation. Epididymal (eWAT), retroperitoneal (rpWAT), inguinal (iWAT), and perirenal (prWAT) fat pads weight (A). Serum triglyceride (B) and cholesterol (C). H&E sections of Ctl, Old, and Old + TUDCA in eWAT (D) (scale bar 50 µm, 20 × magnification). Epididymal WAT adipocyte area (E) and number (F). Liver triglyceride (G) and cholesterol (H) content. Data are presented as mean ± SEM (n = 5–10). Statistical analysis was performed using the one-way ANOVA test, followed by Tukey post-hoc-test. Letters shared in common between groups indicate no significant difference. Different letters (a, b, and c) indicate statistical difference between groups (P ≤ 0.05).

