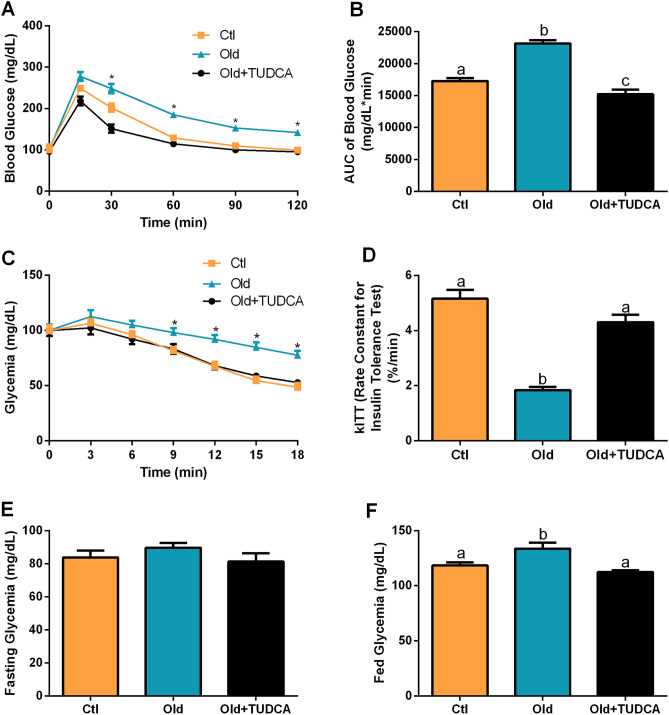
Figure 3.
Effects of TUDCA treatment upon glucose tolerance and insulin sensitivity. Blood glucose (A) and AUC of blood glucose (B) during the i.p. GTT. Blood glucose (C) and rate constant for glucose disappearance (kITT) (D) during the i.p. ITT. Fasting (E) and fed (F) glycemia. Data are presented as mean ± SEM (n = 8–10). Statistical analysis was performed using the one-way ANOVA test, followed by Tukey post-hoc-test. Letters shared in common between groups indicate no significant difference. Different letters (a, b, and c) indicate statistical difference between groups and * indicate Old is different from Ctl and OLD + TUDCA mice (P ≤ 0.05).

