Figure 4.
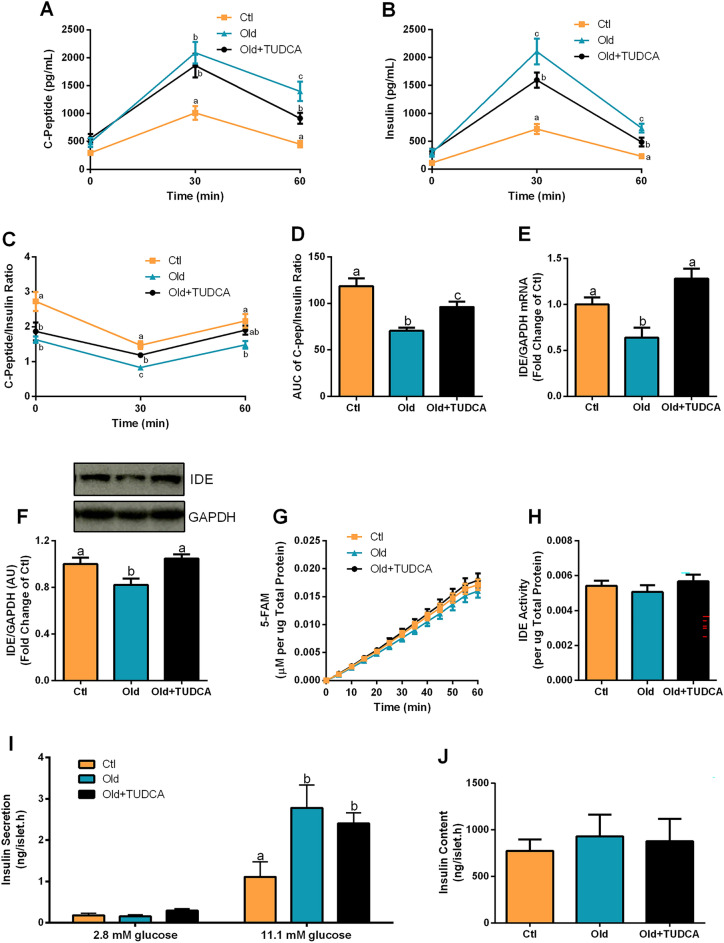
Effects of TUDCA treatment upon insulin clearance and secretion. Plasma c-peptide (A), insulin (B), and c-peptide/insulin ratio (C) before (0 min), 30 and 60 min after the glucose administration, and AUC of plasma c-peptide/insulin ratio (D). Gene expression of IDE (E), and protein content of IDE (F) in the liver, both normalized by GAPDH. Kinetic of the IDE activity assay (G) and total IDE activity (H) in the liver. Fluorescent intensity at Ex/Em = 490/520 nm was continuously recorded, every 5 min, for 60 min. 5-FAM concentration was calculated using a standard curve and normalized per μg of total protein in the liver. Insulin secretion of isolated pancreatic islets after 1 h incubation with 2.8 and 11.1 mM glucose (I) and total insulin content per islet (J). Data are presented as mean ± SEM (n = 5–10). Statistical analysis was performed using the one-way ANOVA test, followed by Tukey post-hoc-test. Letters shared in common between groups indicate no significant difference. Different letters (a, b, and c) indicate statistical difference between groups (P ≤ 0.05). AU arbitrary units.

