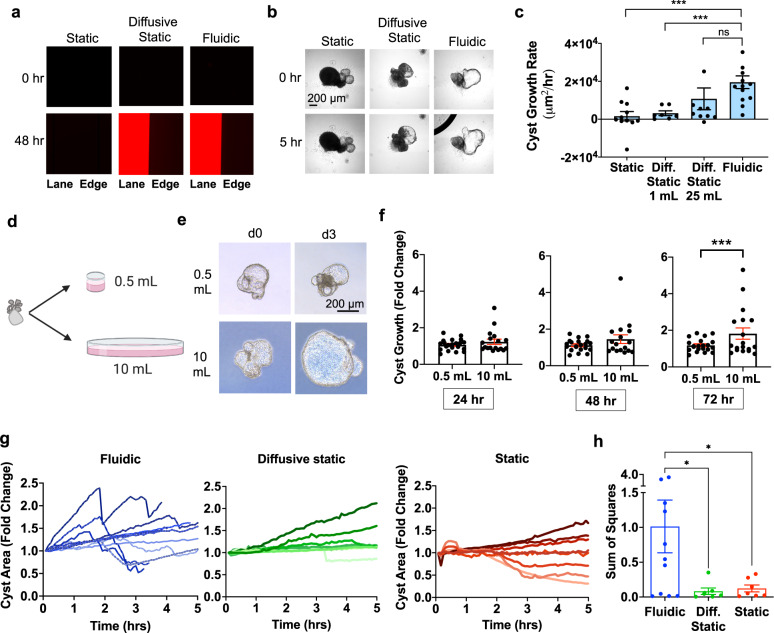
Fig. 2. Volume can partially substitute for flow in cyst expansion.
a Rhodamine dextran (10 kDa) epifluorescence in static (non-diffusive), diffusive static, and fluidic conditions. ‘Lane’ indicates channel interior, and b time lapse phase contrast images of cysts in these conditions. Images are representative of n ≥ 4 independent experiments. c Average growth rates (μm2/hr) of cysts in diffusive static condition with different volumes, compared to fluidic or non-diffusive static. Each experiment was performed for 6 h. Cyst growth rate was calculated on an individual basis as the maximal size of the cyst during the time course, divided by the time point at which the cyst reached this size. (n ≥ 8 cysts (dots) pooled from two or more independent experiments; ***p < 0.05). d Schematic of experiment testing effect of volume vs. pressure on cyst growth. Elements of the image were illustrated using Biorender software under license. e Representative phase contrast images and (f) quantification of growth rate of cysts suspended in either 0.5 or 10 mL of media under equivalent hydrostatic pressures (mean ± s.e.m. of n ≥ 14 cysts per condition pooled from three independent experiments; ***, p < 0.05). g Growth profiles of individual cysts (lines) over time in microfluidic devices from 0–5 h. Measurements made every 5 min using ImageJ software. Cyst Area was normalized by dividing by the starting area. Data points are from three or more independent experiments. h Sum of Squares values from linear regression models were run on each individual cyst (n ≥ 7 organoids per condition, pooled from four or more independent experiments; p = 0.0342 versus diffusive static and 0.0411 versus static). Error bars, standard error.

