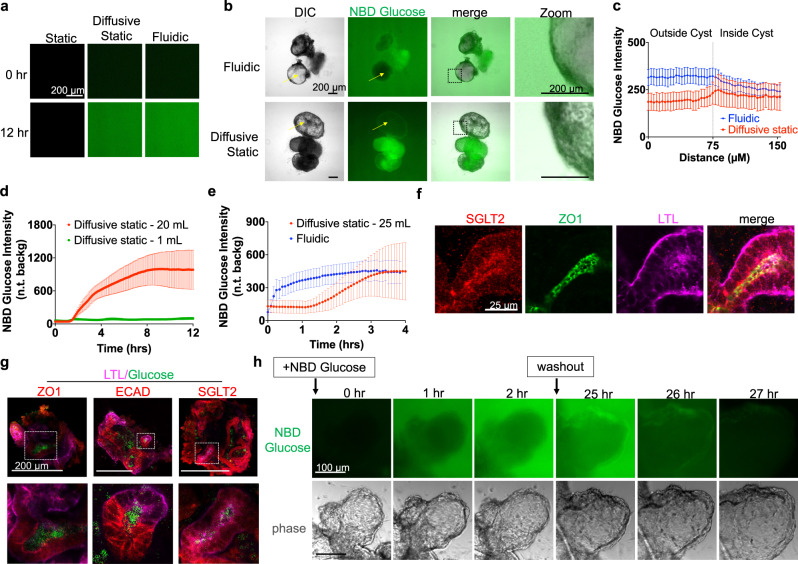
Fig. 3. PKD organoids absorb glucose under fluidic and static conditions.
a NBD Glucose background levels in non-diffusive static, diffusive static, and fluidic conditions after 12 h (representative of three independent experiments). b Phase contrast and wide field fluorescence images of organoids in diffusive static and fluidic conditions, 5 h after introduction of NBD glucose (representative of three independent experiments). Arrows are drawn to indicate representative line scans. c Line scan analysis of glucose absorption in PKD cysts under static and fluidic conditions after 5 h (mean ± s.e.m. from n ≥ 7 cysts per condition pooled from three independent experiments; each n indicates the average of four line scans taken from a single cyst). Background fluorescence levels were calculated at each timepoint by measuring the fluorescence intensity of a square region placed in the non-organoid region of the image. d NBD Glucose absorption in the non-cystic compartment of PKD organoid, for Diffusive static 20 mL vs. 1 mL (110 µM NBD Glucose, mean ± s.e.m., n ≥ 4 independent experiments), and (e) diffusive static 25 mL vs. Fluidic (36.5 µM NBD Glucose, n ≥ 5 independent experiments). f Confocal fluorescence images of SGLT2 and ZO1 in PKD1 tubules (representative of three independent experiments). g Confocal fluorescent images of NBD Glucose in organoid tubules, fixed and stained with fluorescent cell surface markers (representative of three independent experiments). h Time-lapse images of NBD Glucose accumulation in a PKD organoid cyst, followed by washout into media containing unlabeled glucose after 24 h, all performed under continuous flow (representative of three independent experiments).

