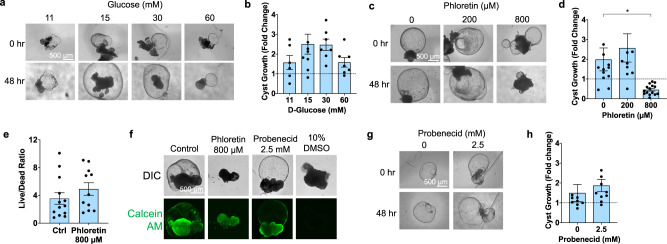
Fig. 4. PKD cysts expand in response to glucose stimulation.
a Representative time lapse brightfield images and (b) quantification of change in cyst size in PKD organoids in static suspension cultures containing with D-Glucose concentrations (mean ± s.e.m., n ≥ 6 pooled from four independent experiments, each dot indicates a single cyst). c Representative time lapse images and (d) quantification of PKD organoids in 15 mM D-Glucose treated with phloretin (mean ± s.e.m., n ≥ 10 cysts pooled from four independent experiments, p = 0.0231). e Quantification of maximum intensity projections of live/dead staining in organoids treated with phloretin (mean ± s.e.m., n ≥ 11, pooled from two independent experiments, each dot indicates a cystic organoid). f Images of live staining with Calcein AM (representative of three independent experiments). g Brightfield images and (h) quantification of size changes in cystic PKD organoids in 15 mM D-Glucose treated with probenecid (mean ± s.e.m., n ≥ 9 pooled from two independent experiments).

