
FIGURE 1.
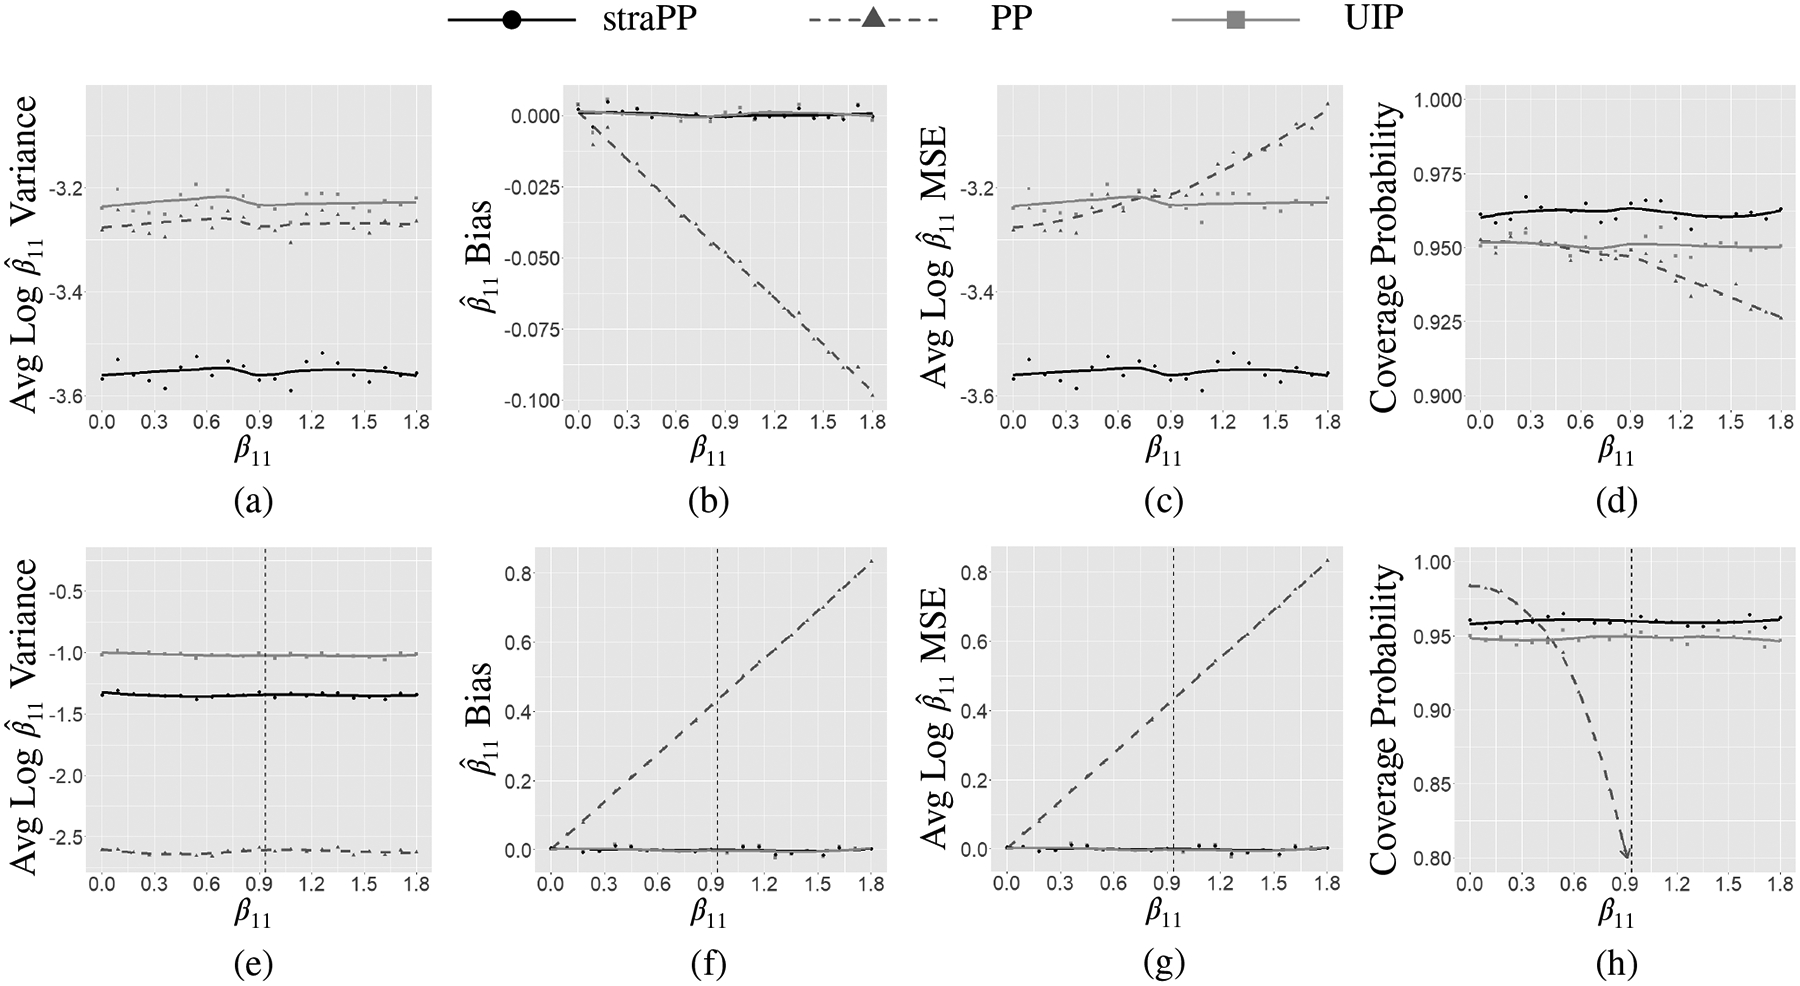
Panels (a)-(d) present the average log variance, bias, log MSE, and coverage probability for the posterior mean of β11, respectively, as a function of the true value of β11 plotted on the x-axis for the case where σ0 = 3,σ 1 = 1 for the scale transformed power prior, power prior, and uniform improper prior. Panels (e)-(h) present the same information for the case where σ0 = 1, σ1 = 3. straPP, scale transformed power prior; PP, power prior; UIP, uniform improper prior.