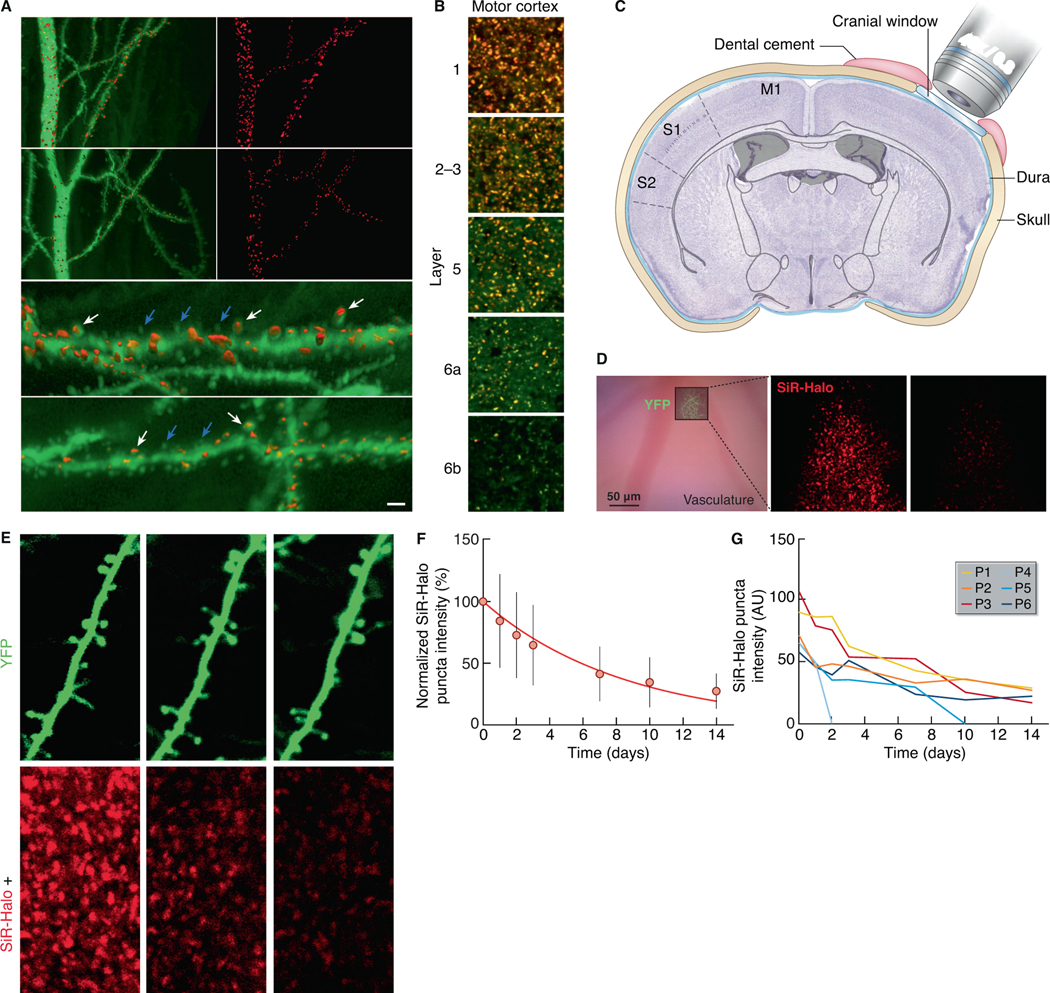
Fig. 3. PSD95 turnover in dendritic spines.

(A) 3D reconstructed dye-filled CA1 neurons and SiR-Halo-positive puncta. (i-iv) CA1 apical dendrites (stratum radiatum) intracellularly injected with Alexa 488 (green) at day 0 (i, ii) and at day 10 post-injection of SiR-Halo (red) (iii, iv). (v, vi) Higher-magnification of (i) and (iii), respectively, showing dendritic spines with SiR-Halo-positive puncta (white arrows) and without SiR-Halo signal (blue arrows). Scale bar: 5 μm (i-iv), 1.5 μm (v, vi). (B) Colocalization (orange) of SiR-Halo (red) injected at day 0 and post-fixation-applied TMR-Halo (green) at day 3 in synapses across layers of the motor cortex. Scale bars: 5 μm. (C) Schematic of the cranial window implant above the somatosensory cortex. (D) Bright-field image (left) of the superficial vasculature and, superposed, a fluorescence image of YFP-labeled axons and dendrites in cortical layer 1 that are used as fiducial points for tracking SiR-Halo ligand puncta over time, as shown for day 0 (center) and day 7 (right). (E) A YFP-labeled dendrite (top) containing SiR-Halo-labeled puncta (bottom), repeatedly imaged over days to weeks. SiR-Halo puncta can be tracked in stable and dynamic spines (e.g. P1-P5) and in the immediate surrounding of the dendrite (e.g. P6). (F) The mean (± SD) fluorescence intensities of individual SiR-Halo puncta (n=295; N=3 Psd95HaloTag/HaloTag mice) normalized to the first imaging time point. Red line, a single exponential fit of the means (λ=0.12/day; t1/2=5.8 days). (G) The measured fluorescence intensity over time of the SiR-Halo puncta examples in (E).
