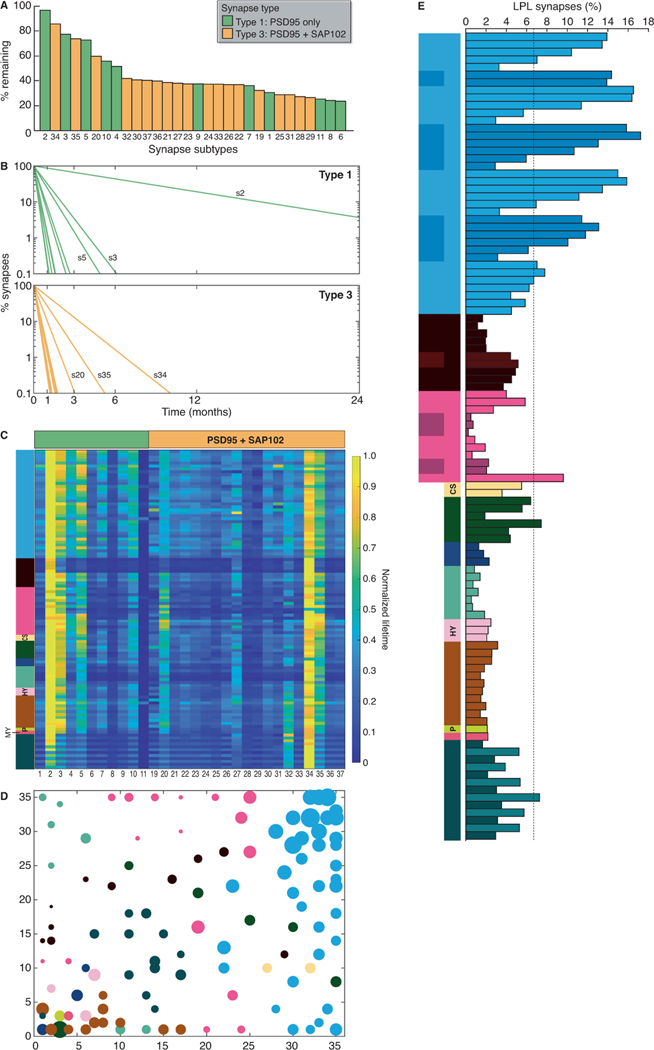
Fig. 4. PSD95 protein lifetimes differ between synapse subtypes.
(A) Ranked bar plot of synapse subtypes (coded 1–37, Zhu et al, 2018) according to their associated PSD95 lifetimes using whole-brain data. Shown is the percentage of each SiR-Halo-positive subtype remaining at day 7 compared with day 0. (B) Decay curves of PSD95 lifetime in type 1 and type 3 synapse subtypes, shown as percentage of synapses retaining SiR-Halo. Longest-lived subtypes (s) are indicated. (C) Synapse subtype PSD95 protein lifetimes for 110 brain subregions represented as a heatmap. The values in each row are normalized. (D) Self-organizing feature map (SOM) clustering based on subtype densities (STAR Methods). Color key as in Fig. 2A. (E) Percentage of LPL synapses in brain regions and subregions (Table S1). The cortical layers in isocortex are numbered and shown from top to bottom. Days 0 and 7 n=8 Psd95HaloTag/eGFP;Sap102mKO2/y mice.

