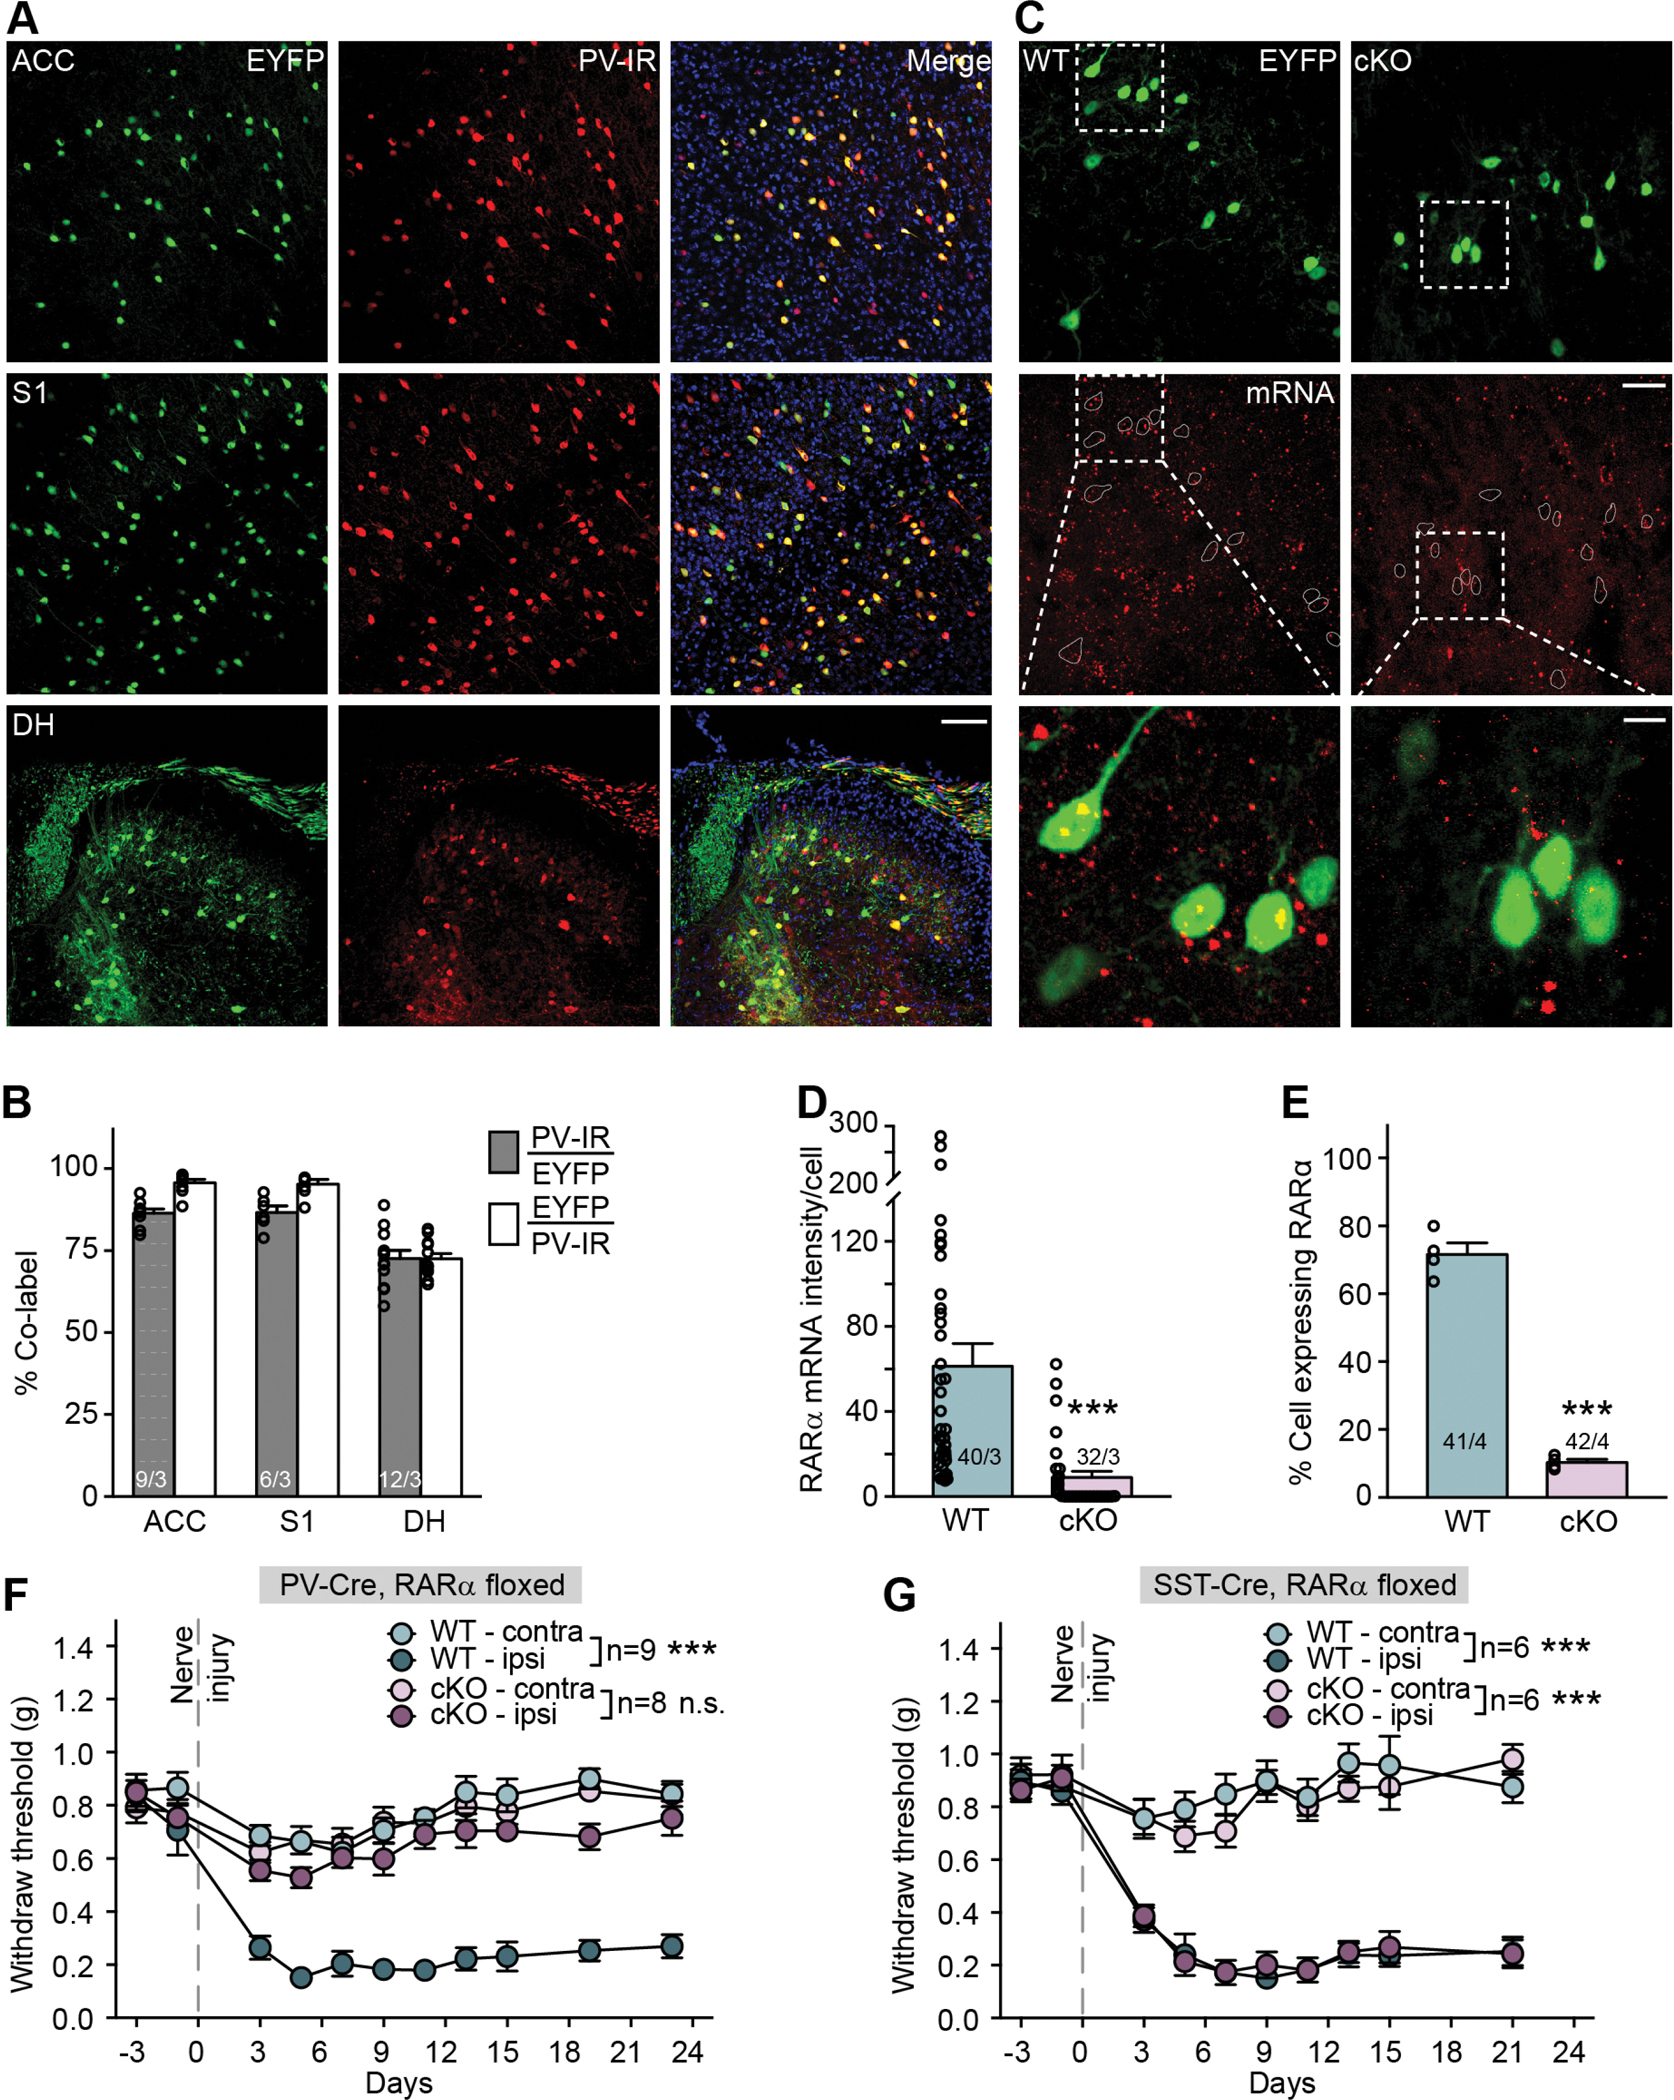
Figure 1. Deletion of RARα in parvalbumin-expressing (PV+) neurons blocks mechanical hypersensitivity development.

(A) Representative images of anterior cingulate cortex (ACC), primary somatosensory cortex (S1) and spinal cord dorsal horn lumbar region (DH) showing Cre-dependent EYFP reporter (green) and PV-immunoreactivity (PV-IR, red) in PV-Cre::RARα cKO mice. Scale bar: 100 μm. (B) Quantification of PV-Cre driver line expression fidelity (% PV-IR/EYFP) and efficacy (% EYFP/PV-IR) in ACC, S1 and DH. n/N = # of section/# of animals. (C) Representative images of RNA scope in situ hybridization shows RARα mRNA expression (red) in spinal cord sections from WT and PV-RARα cKO mice. PV+ neurons are indicated by EYFP reporter (green). Scale bar: 50 μm. The overlay images of insets (square with white dashed line) are shown at bottom (scale bar: 10 μm). (D) Quantification of RARα mRNA expression with RNAscope in WT (n/N = 40 cells/3 mice) and cKO mice (n/N = 32 cells/3 mice). Mann Whitney test: U = 136, ***, p < 0.001. (E) Quantification of RARα mRNA expression percentage with single-cell qRT-PCR showing percent of RARα+ neurons in PV-expressing spinal dorsal horn neurons (WT: n/N = 41 cells/4 mice; cKO: n/N = 42 cells/4 mice). Two-tailed unpaired t test: t = 17.4, ***, p < 0.001. (F) Mechanical hypersensitivity quantified as paw withdrawal threshold with Von Frey test from hindlimbs ipsilateral and contralateral to the SNI side in WT and PV-RARα cKO mice before and over a period of 3 weeks following SNI surgery. Two-way ANOVA with post-hoc Bonferroni test, WT contra vs. ipsi: interaction (days × SNI), F(10, 160) = 11.21, ***, p < 0.001; SNI factor, F(1, 16) = 121.1, ***, p < 0.001; cKO contra vs. ipsi: interaction, F(10, 140) = 1.22, p = 0.29; SNI factor, F(1, 14) = 2.52, p = 0.13. (G) Mechanical hypersensitivity quantified as paw withdrawal threshold with Von Frey test from hindlimbs ipsilateral and contralateral to the SNI side in WT and SST-RARα cKO mice before and over a period of 3 weeks following SNI surgery. Two-way ANOVA with post-hoc Bonferroni test, WT contra vs. ipsi: interaction (days × SNI), F(9, 90) = 12.62, ***, p < 0.001; SNI factor, F(1, 10) = 125.9, ***, p < 0.001; cKO contra vs. ipsi: interaction, F(9, 90) = 16.83, ***, p < 0.001; SNI factor, F(1, 10) = 99.95, ***, p < 0.001. All graphs represent mean ± SEM.
