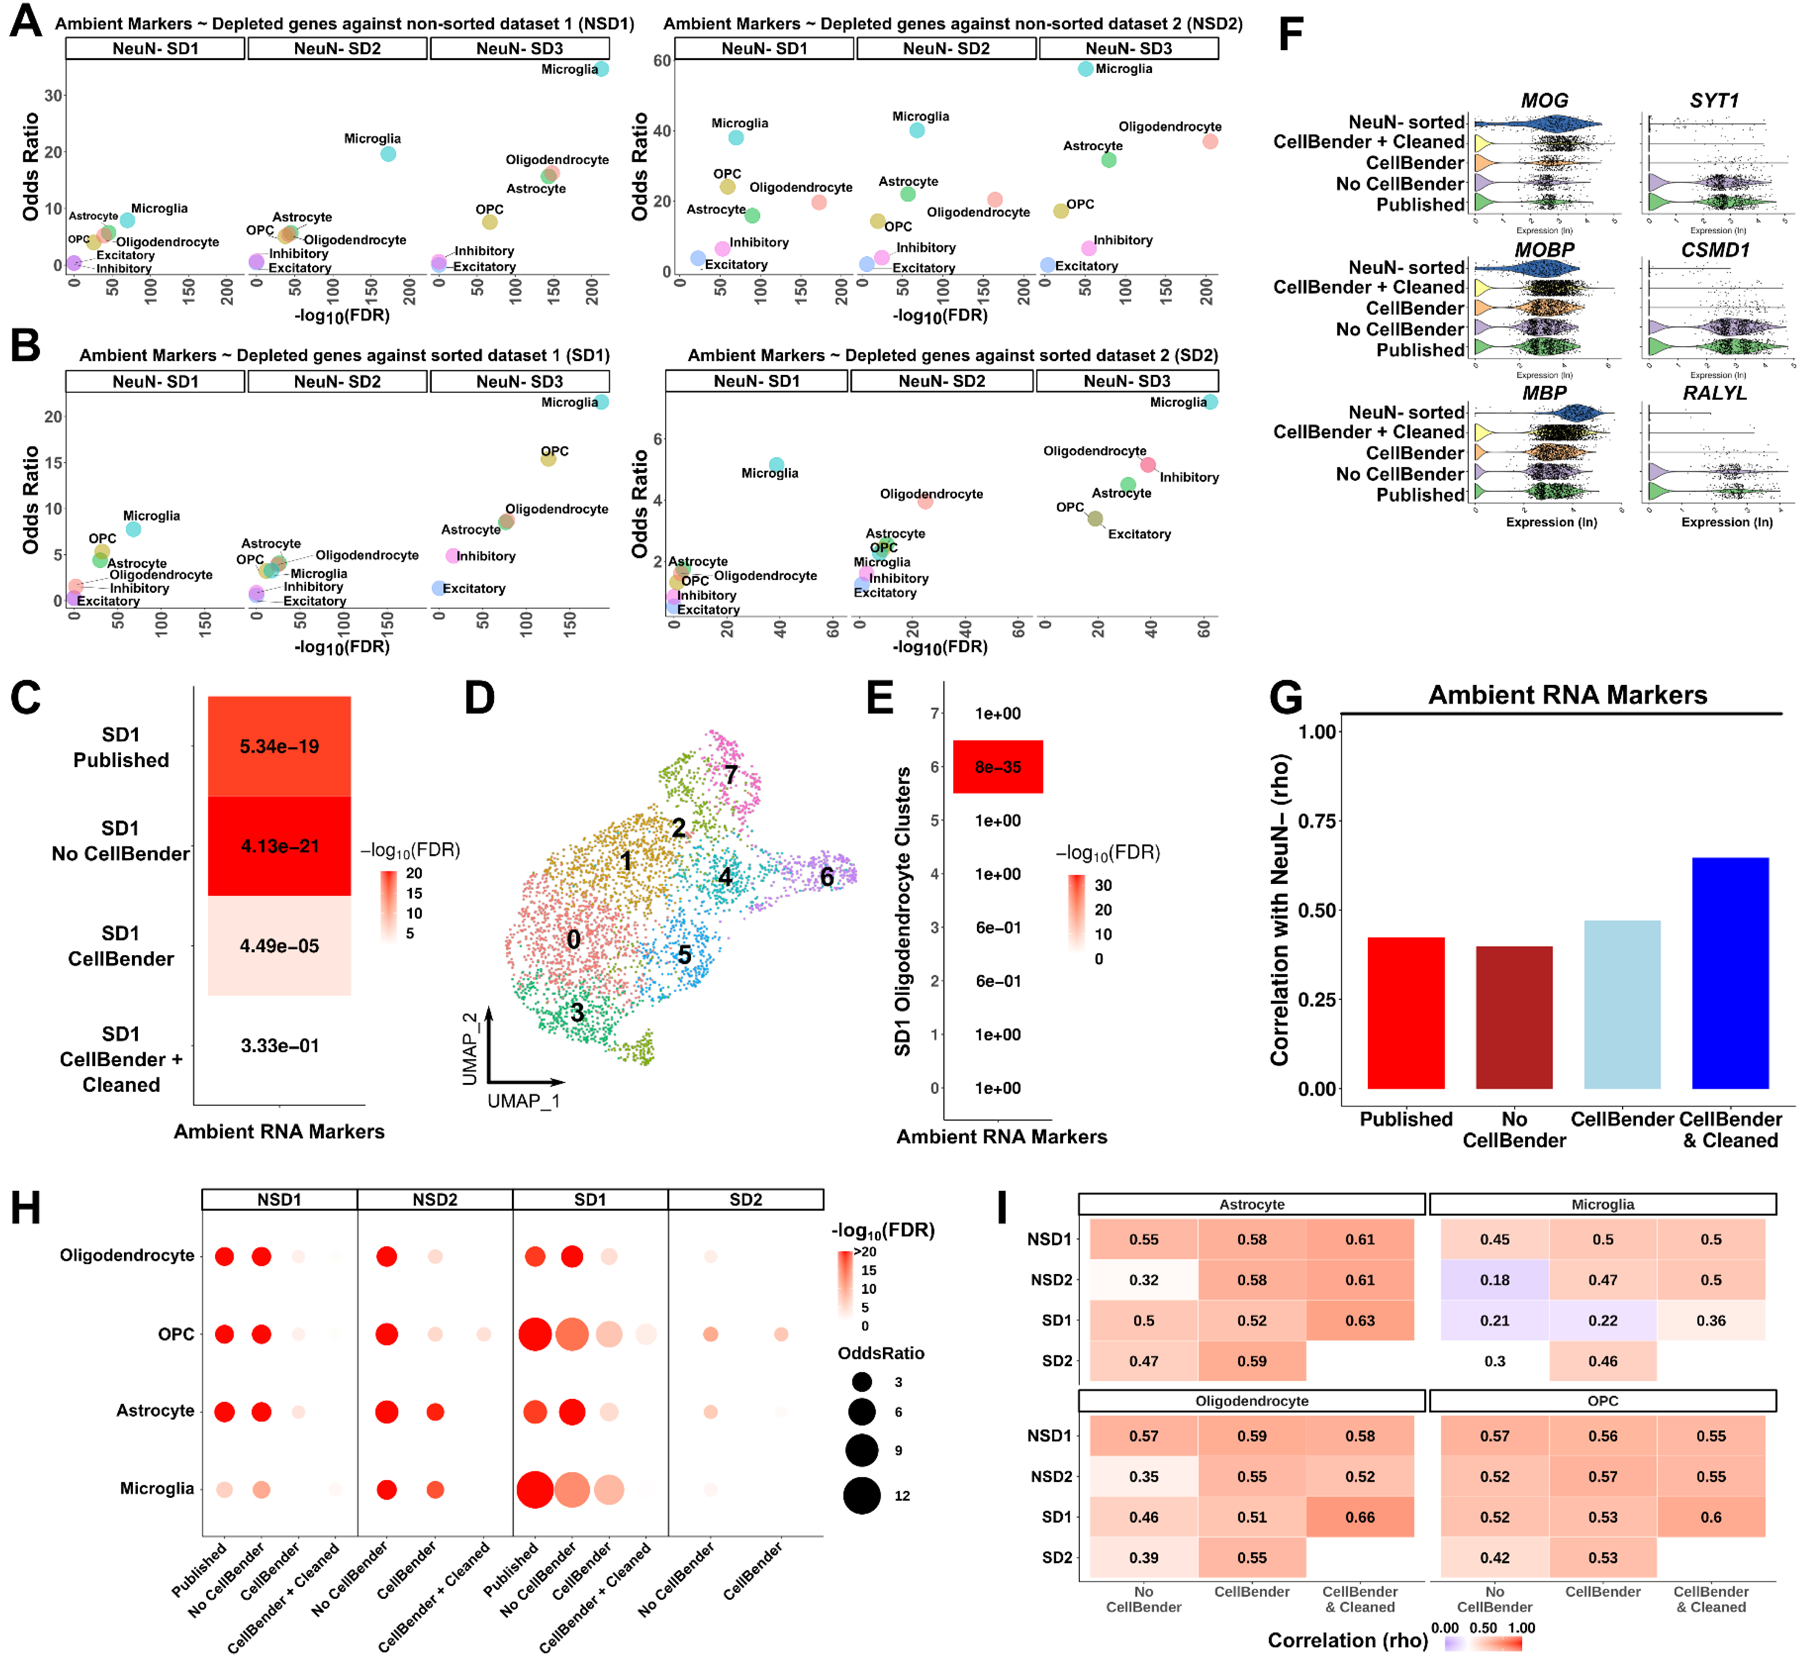
Figure 3. Ambient RNAs contaminate glia expression profiles.

(A-B) Dot plots using odds ratio and FDR adjusted p-values as measurements of ambient RNA enrichment of genes depleted in NeuN- sorted datasets compared to other datasets that did not perform NeuN- sorting; comparisons include: (A) between NSDs and NeuN- SDs; (B) between SDs and NeuN- SDs (per major cell type using a Fisher’s exact test). (C) The same enrichment as in (A-B) after each analysis (in y-axis as rows) performed in oligodendrocytes from the SD1 dataset. Numbers: FDR value; colors scale: −log10(FDR). (D) UMAP plot of SD1 oligodendrocytes after CellBender. (E) Heatmap of enrichment between oligodendrocyte cluster markers and ambient RNA markers. (F) Violin plots of gene expression (log transformed) in oligodendrocytes after each analysis. Left column: oligodendrocyte markers, right column: ambient RNA markers. NeuN- sorted: NeuN- SD1. (G) Spearman rank correlations of all genes between SD1 oligodendrocytes and NeuN- sorted oligodendrocytes after each analysis (x-axis). (H) The same enrichment as in (C) performed in all datasets and glial cell types after each analysis. (I) Spearman rank correlations of all genes with the NeuN- sorted dataset. Correlations were performed per cell type per dataset (y-axis) after each analysis (x-axis). The numbers and color of the heatmaps indicate the correlation coefficient. See also Figures S3–9 and Table S4.
