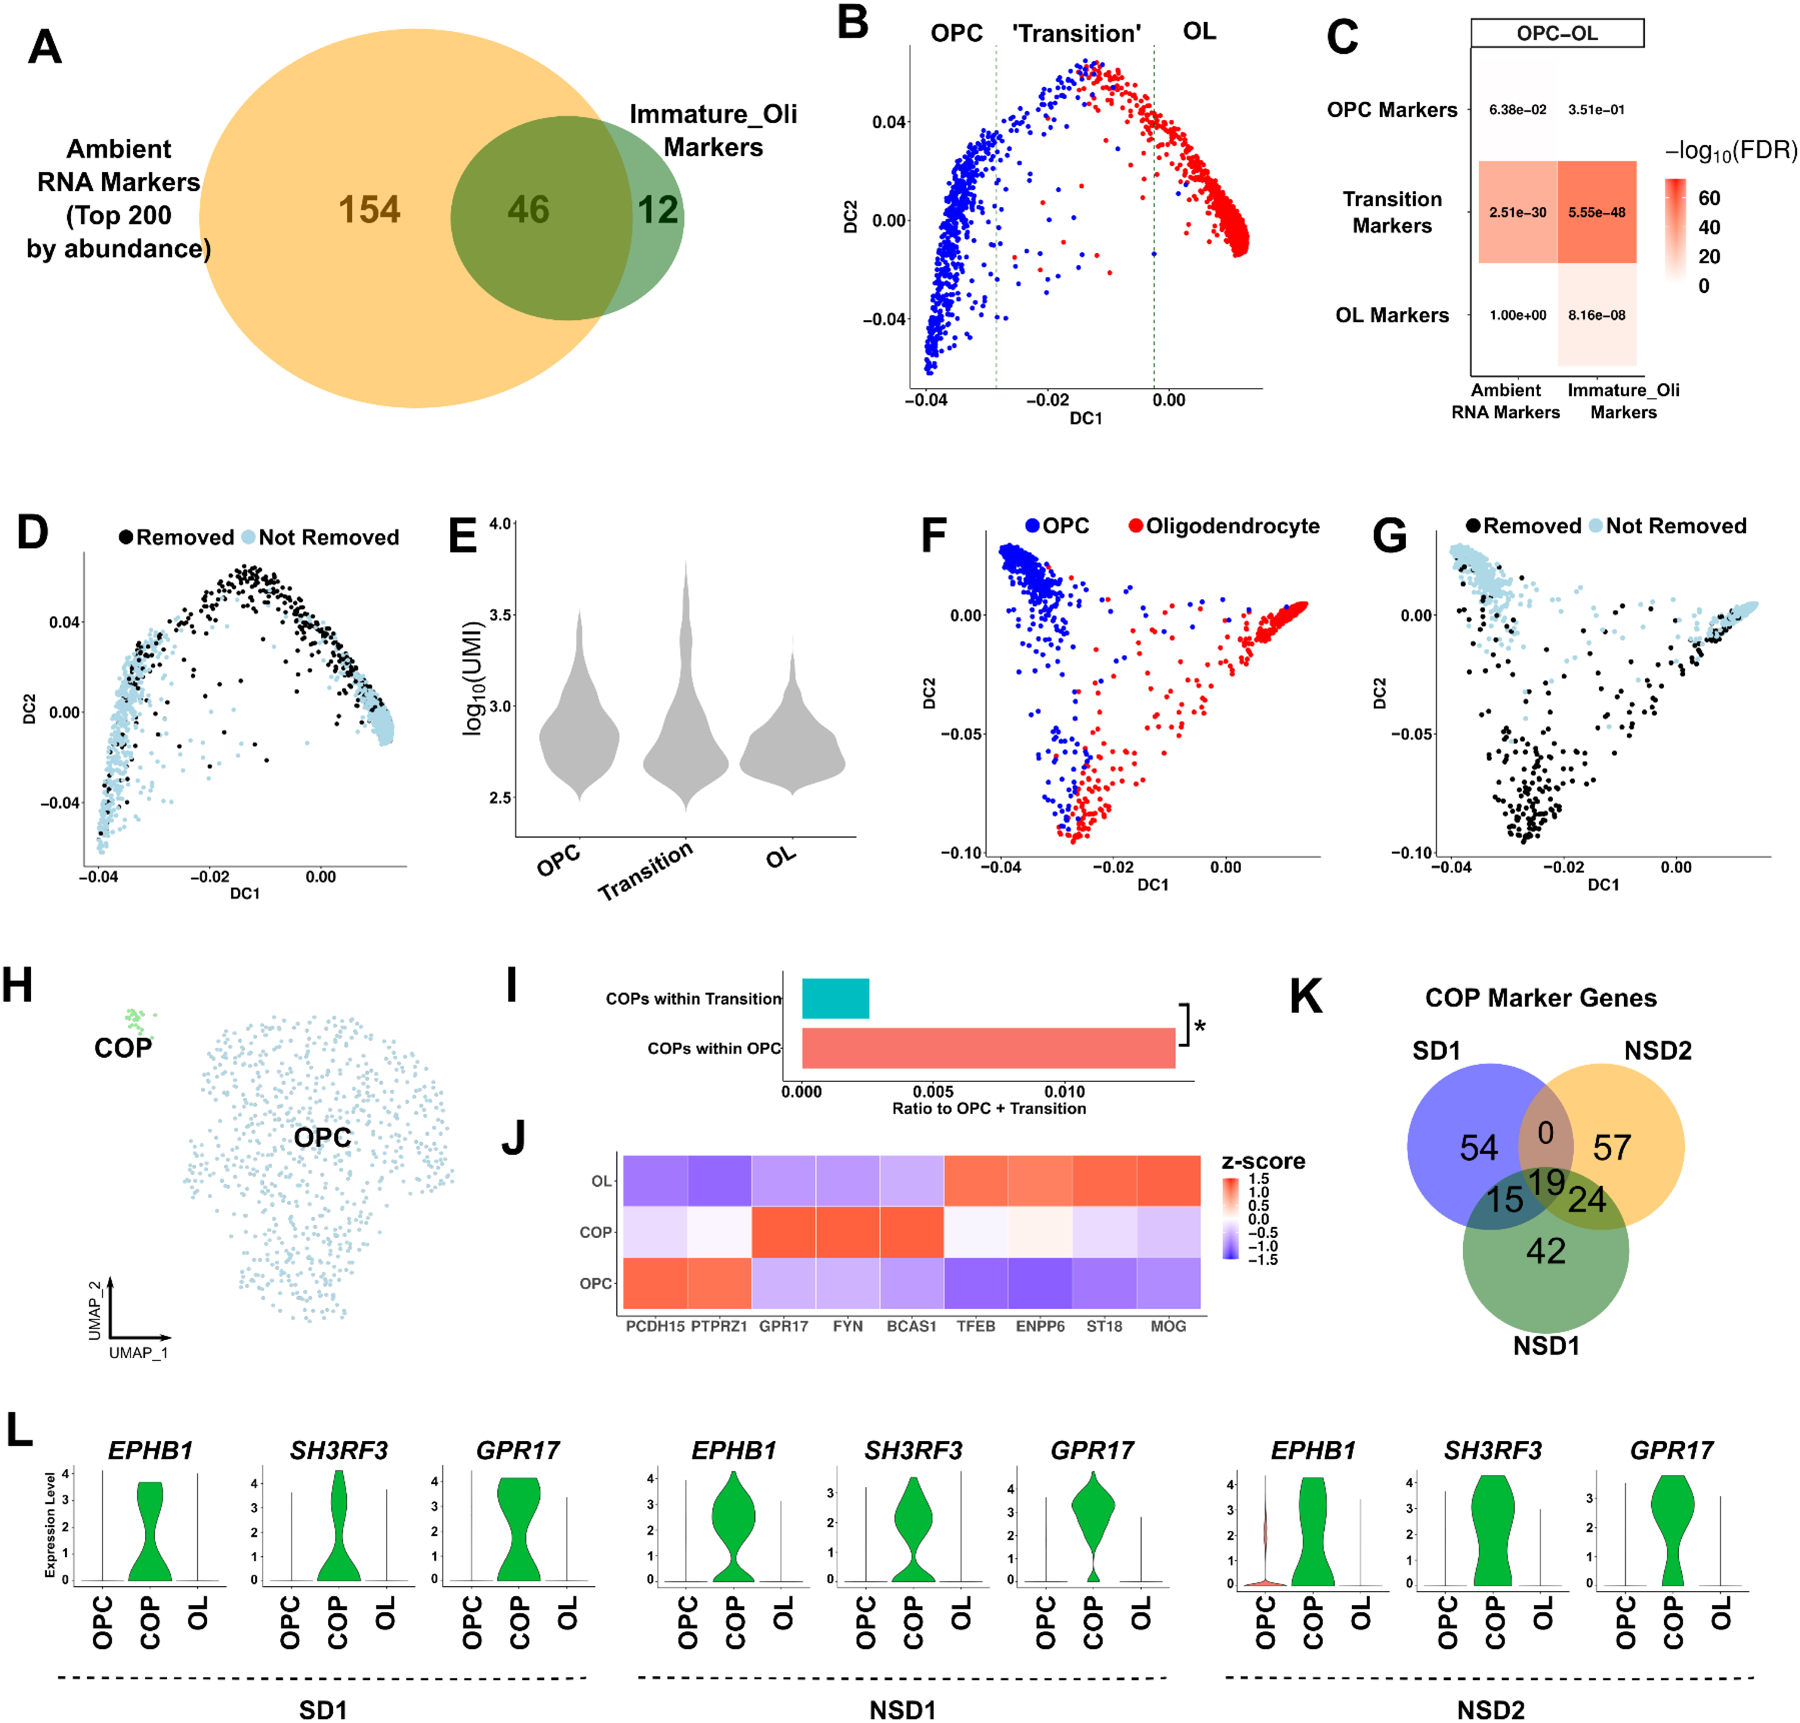
Figure 4. Ambient RNA contamination causes misinterpretation of transitioning oligodendrocytes in the human brain.

(A) Overlap of the immature oligodendrocyte markers in SD1 and the top 200 most abundant ambient RNA markers. (B) The oligodendrocyte lineage trajectory as reconstructed with destiny. The ‘transition’ zone: the 400 cell barcodes around the middle cell barcode based on DC1. (C) Heatmap enrichments between the trajectory zones (OPC, Transition, OL) and either ambient RNA or immature oligodendrocyte markers using a Fisher’s exact test. Numbers: FDR; color scale: −log10(FDR). (D) The same lineage trajectory as (B) with cell barcodes removed after subcluster cleaning highlighted. (E) UMI counts of cell barcodes within the OPC, Transition or OL zones. (F) The oligodendrocyte lineage trajectory after CellBender. (G) The same lineage trajectory as (F) with cell barcodes removed after subcluster cleaning highlighted. (H) UMAP of OPC subclustering. COP: committed OPCs. (I) The ratio of COPs within OPCs or within the transitioning cells to the total number of OPCs and transitioning cells. Asterisk: p-value < 0.05, Chi-square test. (J) Heatmap of oligodendrocyte lineage markers (z-scored across cell types per marker gene). (K) Overlap of COP markers (compared to OPCs) across datasets. The top 100 markers were selected (FDR < 0.05). (L) Violin plots of the expression levels of the top COP markers in three datasets. See also Figures S10–12 and Tables S5–6.
