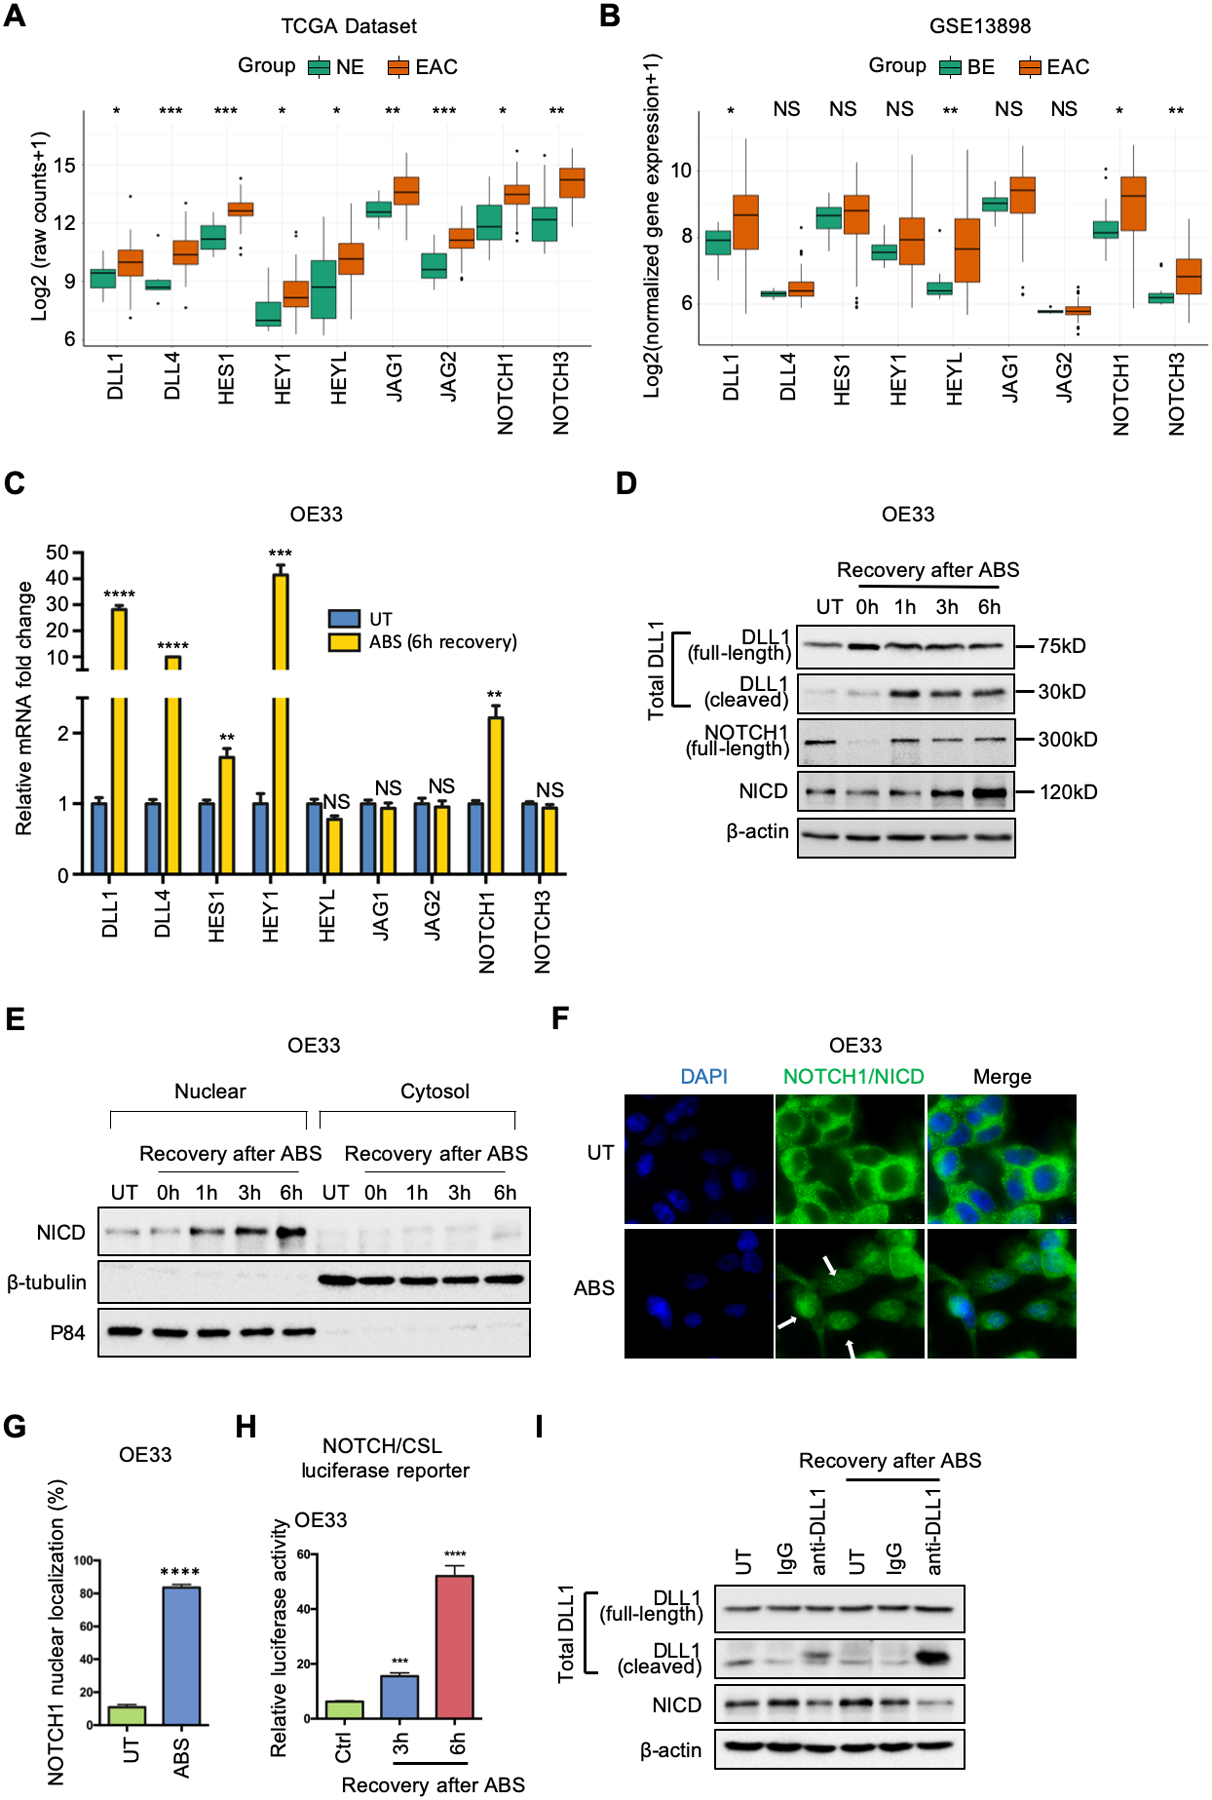
Figure 1.

NOTCH signaling is activated in EAC patients and ABS-provoked cell lines. (A) and (B) Grouped boxplot showing gene expression of core NOTCH signaling components in EAC/BE and normal esophagus tissues in TCGA-EAC database (A) and GSE13898 dataset (B), respectively. (C) qRT-PCR showing mRNA expression levels of key components of NOTCH pathway in OE33 cells after 6h-recovery from ABS exposure. (D) Western blots of total DLL1 (including full-length DLL1 at 75kDa and cleaved DLL1 at 30kDa), full-length NOTCH1 (300kDa), active NOTCH1 intracellular domain (NICD, 120kDa) and β-actin in OE33 cells during indicated recovery time courses after ABS exposure. (E) OE33 cells were harvested for cytosol/nuclear fractionation during 6h-recovery after ABS exposure. Induction of NICD was examined by Western blots. β -tubulin and p84 were used as loading control for cytosol fraction and nuclear fractions, respectively. (F) Representative immunofluorescent staining images of NOTCH1/NICD in OE33 cells after ABS exposure. DAPI was used for nuclear staining. (G) The percentage of NOTCH1 nuclear localization was quantified using three independent fields. (H) NOTCH/CSL luciferase assays were performed in OE33 cells. (I) Anti-DLL1 antibody neutralization blocked NOTCH1 cleavage and activation in OE33 cells. The cells were incubated with DLL1 antibody (10μg/ml) or IgG control (10μg/ml) in full medium before and during recovery of ABS exposure. All quantification analyses were shown as mean ± SEM. Statistical significance was calculated using the Wilcoxon test in the public datasets for two group comparisons. t test was performed to analyze the experimental data for two group comparisons. *p<0.05, **p<0.01, ***p<0.001, ****p<0.0001, NS no significance.
