Figure 5.

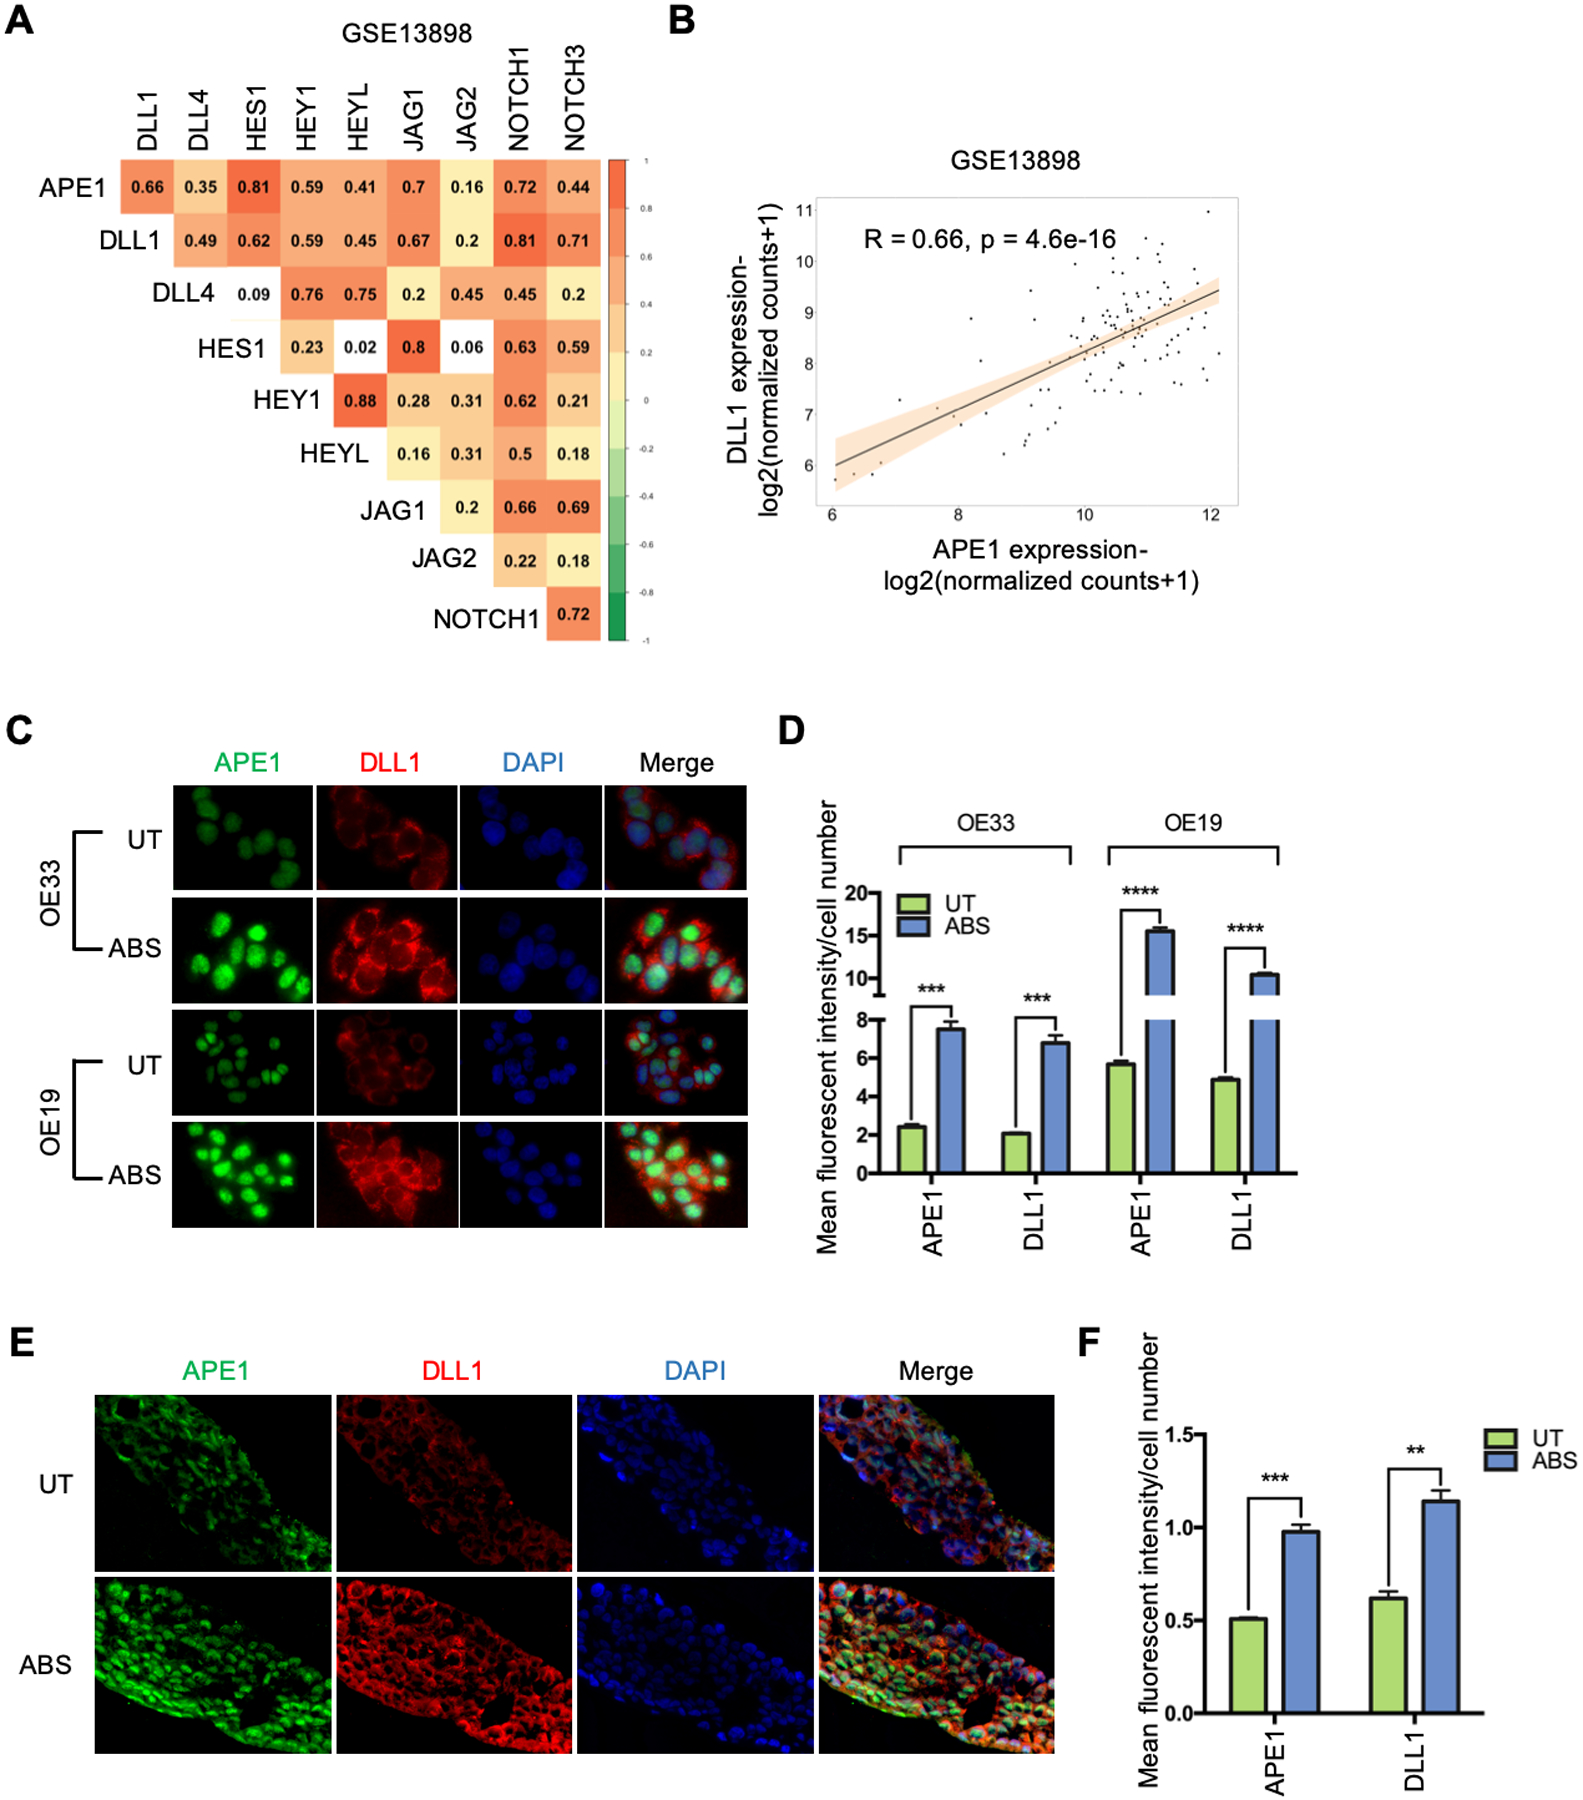
APE1 is correlated and co-overexpressed with DLL1 under ABS exposure. (A) Pearson correlation analysis of APE1 and NOTCH signaling components in a GEO dataset of NE, BE and EAC (GSE13898). (B) APE1 has significant positive correlation with DLL1 at transcription level (R = 0.66, p = 4.6e-16) in the GSE13898 dataset. (C) Representative immunofluorescent staining images of APE1 (green) and DLL1 (red) in OE33 (upper) and OE19 (lower) cells with or without ABS treatment. (D) Mean fluorescent intensity of APE1 and DLL1 was quantified using three independent fields in OE33 (left) and OE19 (right) cells. (E) Representative immunofluorescent staining images of APE1 (green) and DLL1 (red) in OE33-derived 3D organotypic culture with or without ABS treatment. (F) Mean fluorescent intensity of APE1 and DLL1 was quantified using three independent fields. Statistical data are shown as mean ± SEM. **p<0.01, ***p<0.001 and ****p<0.0001 as calculated by t test for two group comparisons.
