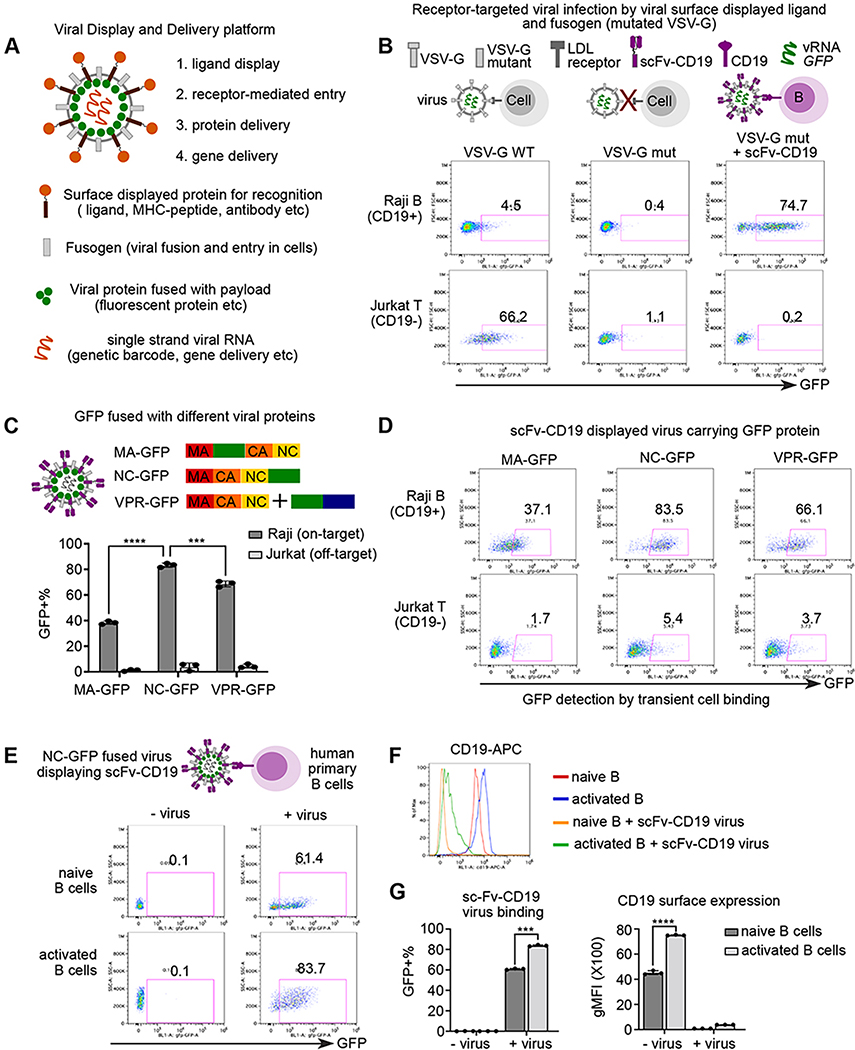
Figure 1. A platform to display ligand proteins and fusogen on viral surface, deliver fluorescent proteins, and record ligand-receptor interaction by cell entry.
A. Schematic view of all-in-one viral platform. The lentiviruses are engineered in diverse modules including: (1) user-defined ligand proteins displayed on viral surface; (2) modified fusogen with intact fusion ability and defective binding to natural receptors; (3) cargo proteins fused with viral structure protein; and (4) barcoded viral RNA for tracing and gene delivery.
B. Schematic view of experimental set up and representative flow plot of GFP expression after 3 days of viral infection. Raji and Jurkat cells are infected by three groups of lentiviruses encoding GFP in the viral RNA: (1) viruses with wild-type VSV-G (left); (2) viruses with receptor-binding mutated VSV-G (middle); (3) viruses with VSV-G mutant and anti-CD19 scFv.
C. Schematic view (top) of experimental set up. GFP protein are fused with matrix protein (MA-GFP) or Nucleocapsid protein (NC-GFP), or viral protein R (VPR-GFP). scFv-CD19 displayed viruses carrying GFP protein fused with different viral proteins were incubated with Raji (CD19+) or Jurkat (CD19−) cells for 2 hours and then subjected to flow cytometry. Bar plot (bottom) showing the percentage of GFP+ cells upon incubation of viruses with different GFP fusion viral proteins.
D. Representative flow plots of GFP signal after transient viral incubation as in Figure 1C.
E. Schematic view of experimental set up and representative flow plot of GFP signal in primary human B cells with or without viral incubation. Naïve and activated human primary B cells were incubated with NC-GFP fused and scFv-CD19 displayed viruses for 2 hours followed by flow cytometry. B cells were gated on live CD20+ cells.
F. Histogram analysis of surface CD19 expression of groups from Figure 1E.
G. Bar plots showing scFv-CD19 virus binding and CD19 surface expression in naïve and activated human B cells
Data are represented as mean +/− SEM in C and G from triplicates.
P-values in Figure 1C and 1F are calculated by unpaired t-test. *** P<0.001, **** P<0.0001

