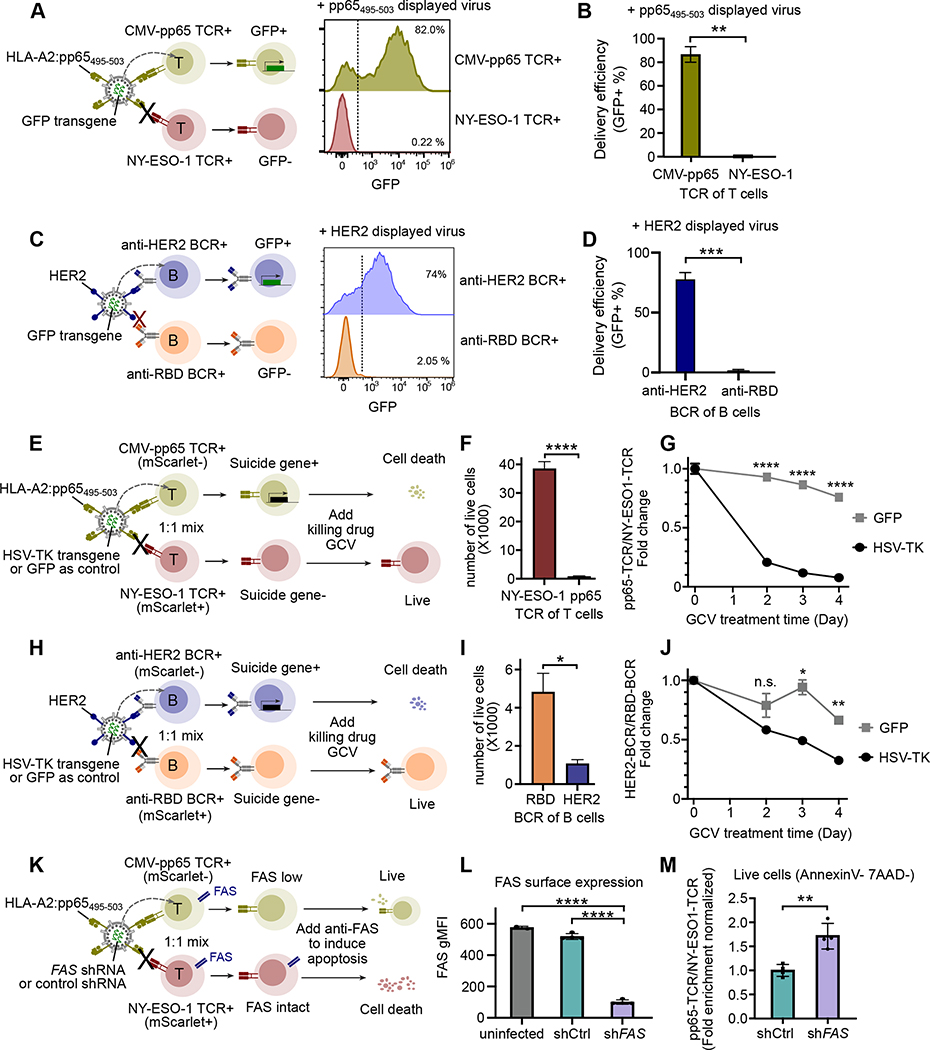
Figure 4. ENTER permits cargo delivery in antigen-specific T or B cells.
A. Schematic view of cargo delivery in antigen-specific T cells (left). CMV-pp65 TCR+ T cells or NY-ESO-1 TCR+ T cells were individually infected with ENTER viruses that display pp65495–503 and carry GFP transgene as a cargo. Representative histogram plot showing GFP expression between CMV-pp65 TCR+ T cells and NY-ESO-1 TCR+ T cells after 2 days infection.
B. Bar plot showing the percentage of GFP+ cells as in Figure 4A.
C. Schematic view of cargo delivery in antigen-specific B cells (left). HER2 BCR+ B cells or RBD BCR+ B cells were individually infected with ENTER viruses that display HER2 and carry GFP transgene as a cargo. Representative histogram plot (right) showing GFP expression between HER2 BCR+ B cells and RBD BCR+ B cells after 2 days infection.
D. Bar plot showing the percentage of GFP+ cells as in Figure 4C.
E. Schematic view of suicide gene delivery in a pool of different antigen-specific T cells. CMV-pp65 TCR+ T cells and NY-ESO-1 TCR+ T cells expressing mScarlet were mixed together and then infected with ENTER viruses that display pp65495–503 and carry HSV-TK transgene. After 2 days of infection, GCV drug was added to kill HSV-TK expressing cells and cell survival was monitored for 4 days.
F. Bar plot showing the number of live T cells at day 4 post GCV treatment.
G. Kinetics analysis of normalized fold enrichment between the number of CMV-pp65 TCR+ T cells versus that of NY-ESO-1 TCR+ T cells that were either infected with ENTER carrying GFP gene or ENTER carrying HSV-TK gene upon GCV drug treatment.
H. Schematic view of suicide gene delivery in a pool of different antigen-specific B cells. HER2 BCR+ B cells and RBD BCR+ B cells expressing mScarlet were mixed together and then infected with ENTER viruses that display pp65495–503 and carry HSV-TK transgene. After 2 days of infection, GCV drug was added to kill HSV-TK expressing cells and cell survival was monitored for 4 days.
I. Bar plot showing the number of live B cells at day 4 post GCV treatment.
J. Kinetics analysis of normalized fold enrichment between the number of HER2 BCR+ B cells versus that of RBD BCR+ B cells that were either infected with ENTER carrying GFP gene or ENTER carrying HSV-TK gene upon GCV drug treatment.
K. Schematic view of shRNA delivery in a pool of different antigen-specific T cells. CMV-pp65 TCR+ T cells and NY-ESO-1 TCR+ T cells expressing mScarlet were mixed together and then infected with ENTER viruses that display pp65495–503 and carry FAS shRNA or control shRNA. Anti-FAS antibody was added to induce apoptosis.
L. Bar plot showing the surface expression of FAS in off-target NY-ESO-1 TCR+ T cells (uninfected group), and on-target CMV-pp65 TCR+ T cells transduced with control shRNA or FAS shRNA.
M. Bar plot showing the CMV-pp65 TCR+ T cells/NY-ESO-1 TCR+ T cells fold enrichment that is normalized by shCtrl group for the live cells (gated on Annexin V and 7-AAD double negative) as in K.
Data are represented as mean +/− SEM in bar plots from at least two biological replicates (4 replicates in M).
P-values are calculated by unpaired t-test. **** P<0.0001; *** P<0.001; **P<0.01; * P<0.05; n.s. P>=0.05

