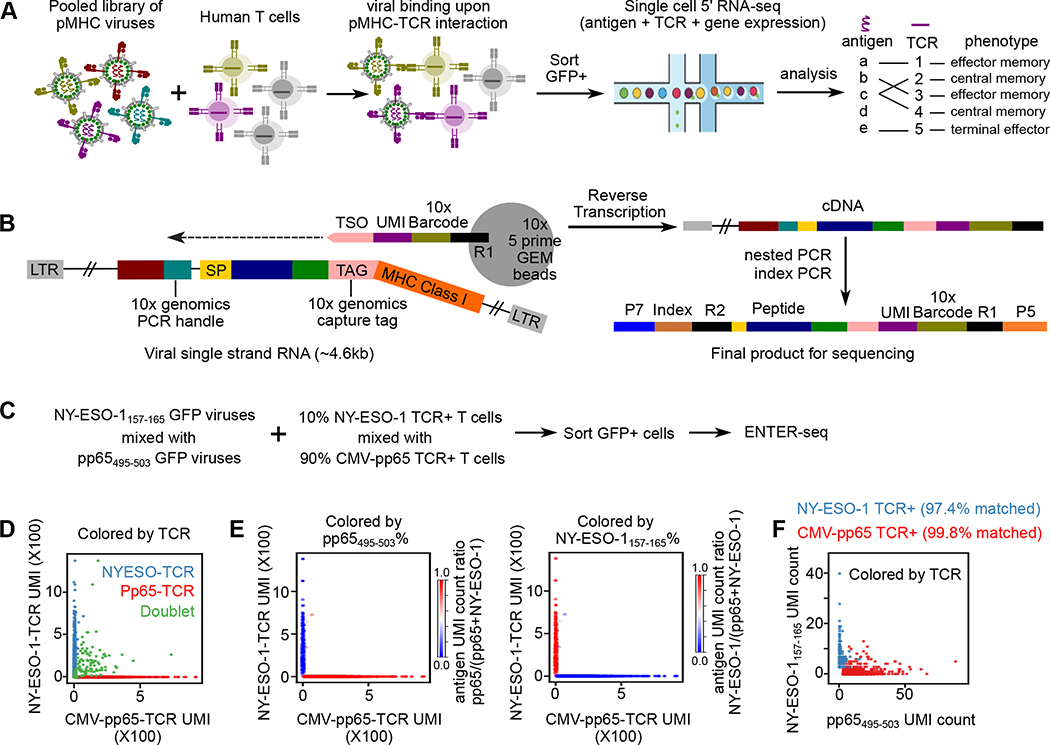
Figure 5. ENTER-seq for massively parallel measurement of antigen peptide sequence, TCR sequence, and transcriptome.
A. Schematic view of ENTER-seq workflow. A library of pooled viruses displaying individual pMHC was incubated with T cells for 2 hours. GFP+ T cells were sorted for droplet-based single cell genomics profiling.
B. Viral RNA engineering strategy for droplet-based single cell capture. 10x genomics capture tag is inserted in the linker region between B2M and HLA-A2. 10x genomics PCR handle is inserted after CMV promoter. CMV: CMV promoter; SP: signal peptide sequence; Peptide: antigen peptide; B2M: Beta-2-Microglobulin; MHC Class I: HLA-A0201 allele; LTR: long terminal repeat; TSO: template switching oligo sequence.
C. Schematic view of T cell mixing experiment for ENTER-seq.
D. Number of Pp65495–503-TCR T cells UMI counts (x-axis) and NY-ESO-1157–165-TCR UMI counts (y-axis) associated with each cell barcode (dot). The colors are assigned as NY-ESO-1157–165-TCR+ T cells (light blue), Pp65495–503-TCR+ T cells (red), and doublets (green, with both NY-ESO-1157–165-TCR and Pp65495–503-TCR).
E. Scatter plots of TCR UMI counts after doublet removal, colored by enrichment ratio of pp65495–503-antigen UMI count among total UMI counts (left), and enrichment ratio of NY-ESO-1157–165-antigen UMI count among total UMI counts (right).
F. Number of pp65(495–503)-antigen UMI counts (x-axis) and NY-ESO-1157–165-antigen UMI counts (y-axis) associated with each cell barcode (dot) after doublet removal. The colors are assigned as NY-ESO-1157–165-TCR + T cells (light blue) and Pp65495–503-TCR + T cells (red).

