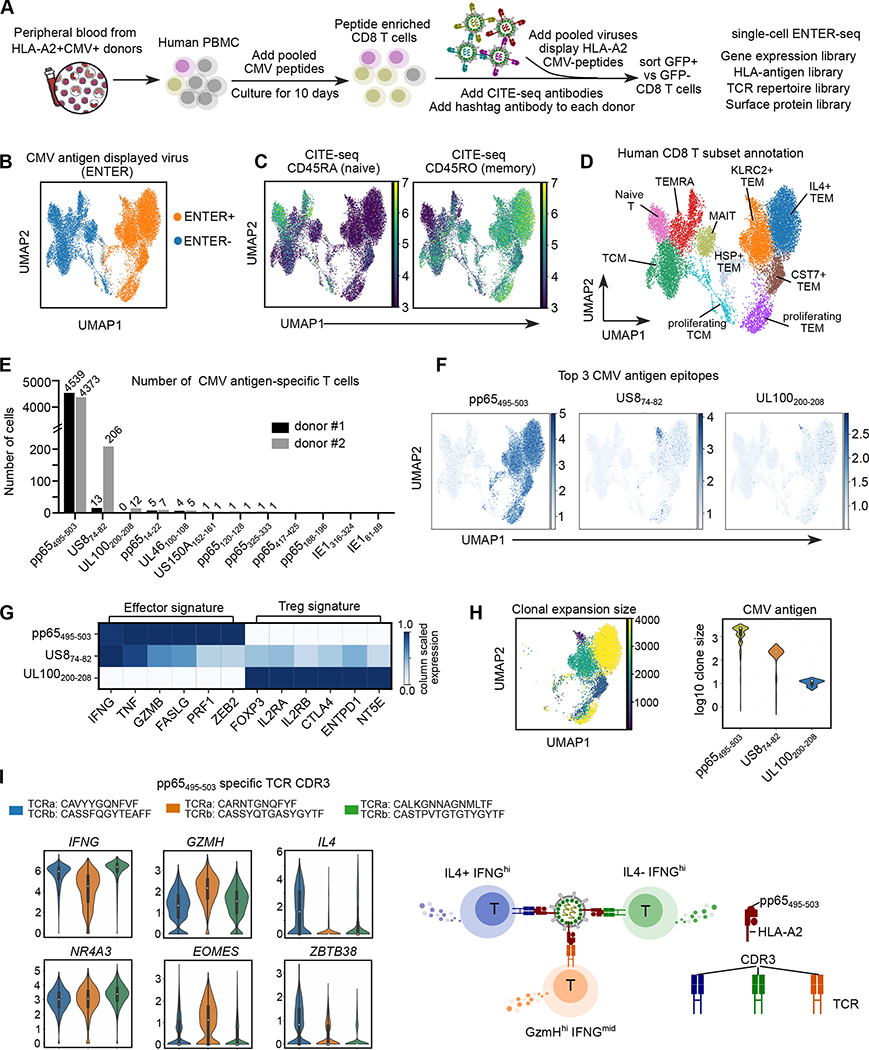
Figure 6. ENTER-seq of ex vivo expanded CMV-specific primary T cells.
A. Schematic view of CMV antigen peptide induced T cell expansion and ENTER-seq workflow.
B. UMAP plot showing cells with (ENTER+, colored in yellow) or without (ENTER−, colored in blue) CMV antigen displayed viruses binding.
C. UMAP plots showing CITE-seq of surface protein expression of CD45RA (naïve marker) and CD45RO (memory marker).
D. UMAP plot showing 10 clusters of human CD8+ T cell subsets labeled in different colors.
E. Bar plot showing the number of CMV antigen-specific T cells that recognize specific CMV antigen epitope in donor #1 (labeled in black) and donor #2 (labeled in gray).
F. UMAP plots showing the amount of CMV antigen epitopes per cell for the top 3 CMV antigen epitopes identified from E.
G. Heatmap showing column scaled expression of representative genes associated with effector function or Treg signature among different CMV antigen-specific T cells.
H. UMAP plot (left) showing the clonal expansion size of CMV antigen-specific T cells colored by the number of cells in each clonotype. Violin plot (right) showing the distribution of clone size in different CMV antigen-specific T cells colored by antigen epitopes.
I. Violin plots showing expression of cytokines and transcription factors in pp65495–503-specific TCR clones, separated and colored by CDR3 clones. A simplified model (right).

