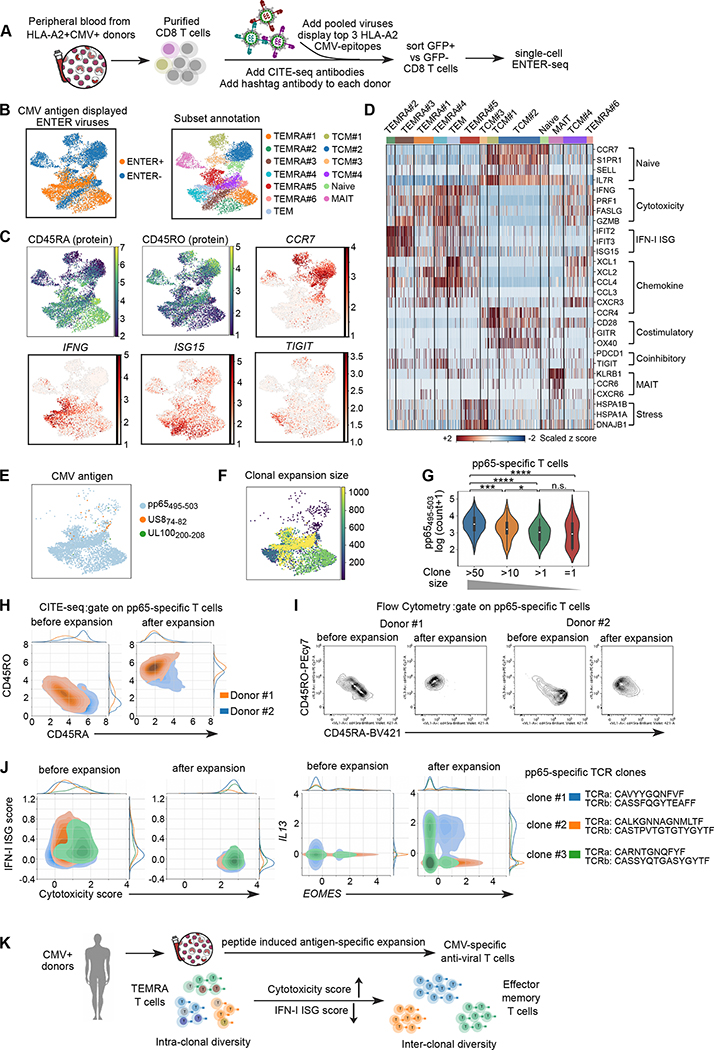
Figure 7. ENTER-seq of primary CMV-specific T cells isolated directly from CMV seropositive patient blood.
A. Schematic view of isolation of primary T cells from patient blood and ENTER-seq workflow.
B. UMAP plot (left) showing cells with (ENTER+, colored in yellow) or without (ENTER−, colored in blue) CMV antigen displayed viruses binding. UMAP plot (right) showing 13 clusters of human CD8+ T cell subsets labeled in different colors.
C. UMAP plots showing the surface protein expression of CD45RA and CD45RO from CITE-seq and expression of representative genes.
D. Heatmap showing the scaled z score of expression of genes associated diverse functions (e.g. type-I IFN, cytotoxicity etc) across different clusters.
E. UMAP plot showing the CMV antigen specificity colored by antigen epitope.
F. UMAP plot (left) showing the clonal expansion size of CMV antigen-specific T cells colored by the number of cells in each clonotype.
G. Violin plot showing the number of pMHC bound per cell in T cells with different clone size. P value was calculated by Mann-Whitney test. n.s. p>=0.05; * p<0.05; ** p<0.01, *** p<0.001, **** p<0.0001
H. CITE-seq density plot showing surface expression of CD45RA and CD45RO in pp65-specific T cells from donor #1 (colored by orange) and donor #2 (colored by blue) before and after peptide-induced expansion.
L. Flow cytometry plots showing CD45RA and CD45RO in pp65-specific T cells from donor #1 and donor #2 before and after peptide-induced expansion.
J. Density plot showing the distribution of type-I IFN ISG gene score and cytotoxicity gene score prior and post peptide-induced expansion in top 3 TCR clones of pp65-specific T cells (left). Density plot showing the expression of IL13 and EOMES prior and post peptide-induced expansion in top 3 TCR clones of pp65-specific T cells (right).
K. A proposed model of phenotypic transition of CMV-specific T cells upon ex vivo expansion.

