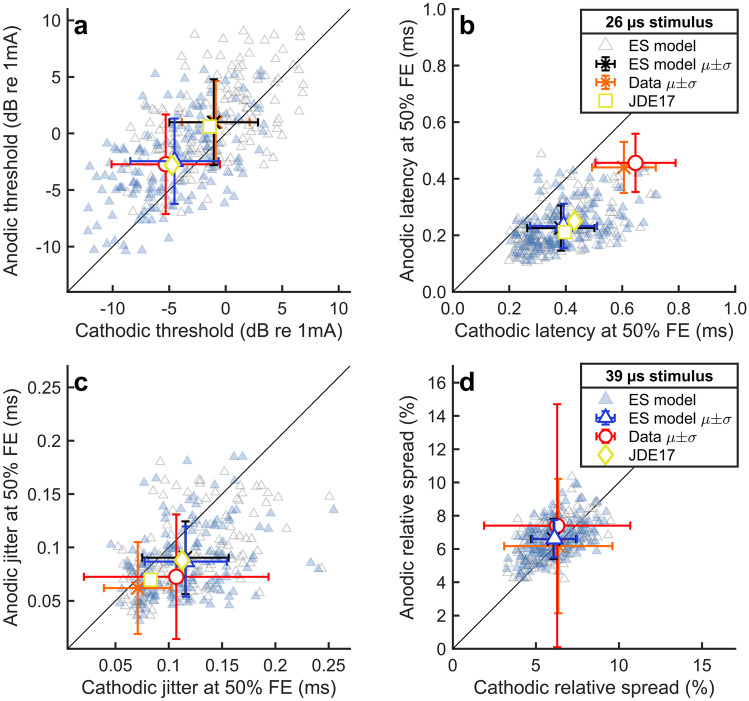
Fig. 2.
Response statistics of the extended ES alone model for monophasic anodic and cathodic pulses with a duration of 26 µs (grey triangles) and 39 µs (blue triangles). a Thresholds, defined as the current resulting in a FE of 50 %. b, c Latency and jitter when stimulating at threshold level. d Relative spread. Mean values (µ) are compared to the corresponding mean experimental data from Miller et al. [55] (see figure legend) and predictions of the original ES model of Joshi et al. [42] (yellow symbols, “JDE17”). Error bars represent the standard deviation (σ) of the data

