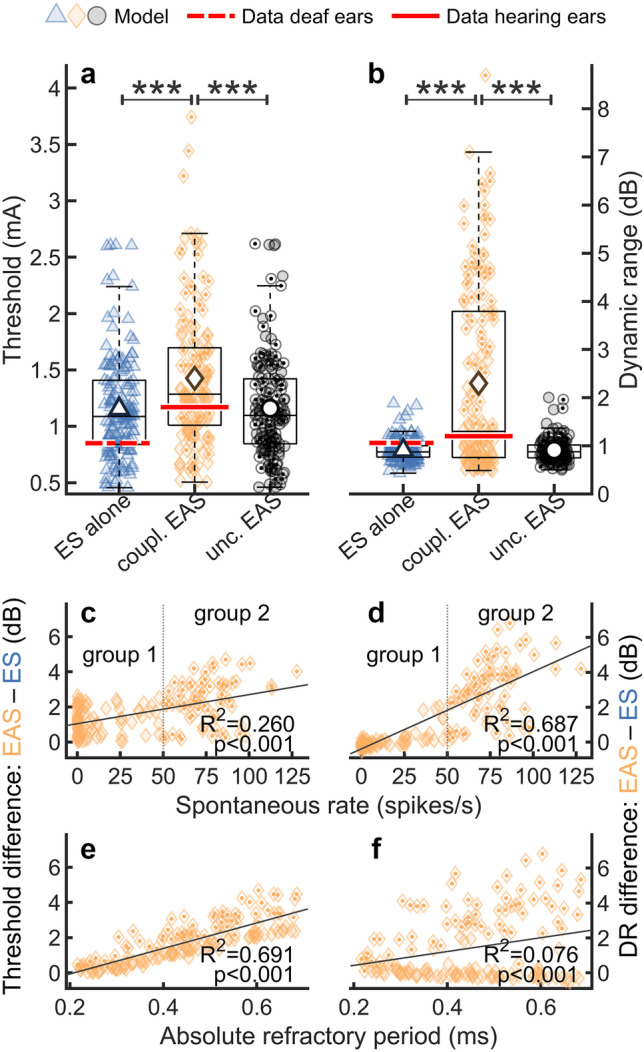
Fig. 3.

Thresholds a and DRs b for ES with 40 µs/phase biphasic pulses. Acoustically sensitive ANFs (uncoupled and coupled EAS model) are compared to acoustically insensitive ANFs without spontaneous activity (ES alone model). Population averages are indicated with large markers inside the boxplots. Experimental data of Miller et al. [58] for ANFs from both hearing and deaf ears is indicated with red horizontal lines. The significance of differences between the model predictions was tested using the Mann–Whitney U-test. c, e Threshold differences between the coupled EAS model and the ES alone model (EAS-ES) as a function of SR and ARP. d, f DR differences between the coupled EAS model and the ES alone model (EAS-ES) as a function of SR and ARP. Lines indicate linear regression of the data. Markers with a dot indicate ANFs with SR > 50 (group 2)
