Fig. 4.
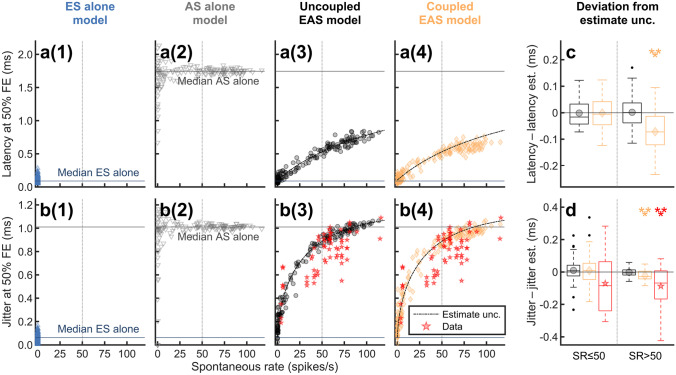
a, b Latency a and jitter b for ES with 250 pps pulse trains as a function of SR for the different model variants. All statistics for the ES alone model and the EAS models were obtained at 50 % FE using a time window of 3.5 ms following each pulse. Median latency and jitter of spontaneous activity predicted by the AS alone model (without stimulation) are shown with horizontal lines. Black dashed lines are identical across panels in each row and indicate the analytical estimate for latency (a3–a4; see Eq. 11) and jitter (b3–b4; see Eq. 12), assuming no EAS interaction. The predictions for jitter were compared to the experimental data of Miller et al. [58] (red stars). c, d Deviation of predicted latency c and jitter d from the corresponding analytical estimate for the data presented in a3–a4 and b3–b4. The ANFs were divided into two groups based on their SR (SR ≤ 50 and SR > 50). Mean values for each EAS model are indicated by symbols inside the boxplots. Significance was tested using Wilcoxon’s signed rank test

