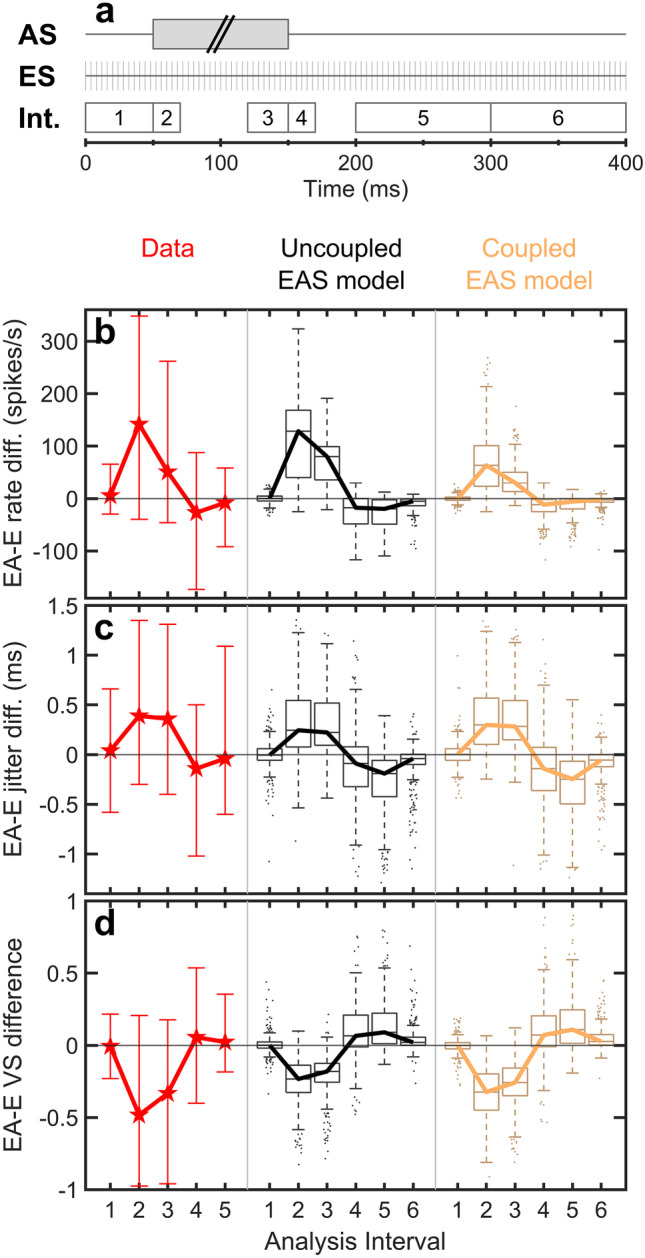
Fig. 5.

a Stimulus paradigm and definition of analysis intervals for experiment 3. The ES pulse train started 50 ms before the AS noise and ended 250 ms after the AS offset. I1 and I2 were defined relative to the AS onset, whereas I3–I6 were defined relative to the AS offset. The experiment was conducted with a mixture of 100 ms, 200 ms, or 300 ms acoustic noise stimuli. b–d Predictions for the six analysis intervals, pooled across AS duration and ES level. The plots show the “EA-E” differences between the electric + acoustic and the electric-only conditions for spike rate b, jitter c, and vector strength (VS) d. Predictions obtained with the uncoupled EAS model (black) and the coupled EAS model (yellow) are compared to the median experimental data of Miller et al. [21] (red stars). Error bars for the experimental data represent the range of the data set
