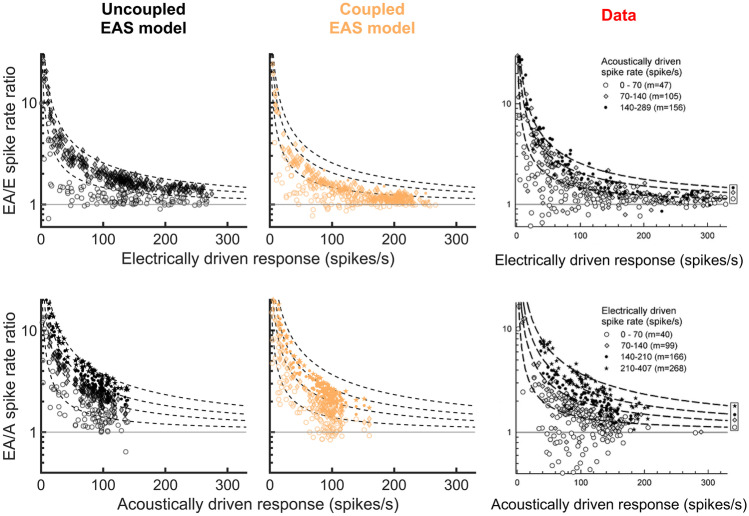
Fig. 6.
Sustained spike rates measured during analysis interval I3. Top row: ratios of spike rates evoked by the electric + acoustic stimuli (EA) and the electric-only stimulus (E), plotted against the electric-only rate. Bottom row: same as in the top panels, but using the acoustically driven spike rate (A) instead of the electrically driven rate. Predictions of the uncoupled and the coupled EAS models are compared to experimental data of Miller et al. [21]. The ANFs have been grouped according to their acoustically driven (top row) or electrically driven (bottom row) spike rate as indicated in the legends. The dashed lines indicate the theoretical curve for each group median of the experimental ANF population, assuming linear addition of E + A spike rates. They are identical across the panels in each row, allowing for a better orientation when comparing simulated and experimental results. The data have been reprinted by permission from the Association for Research in Otolaryngology: Springer Nature, JARO - Journal of the Association for Research in Otolaryngology, Miller et al. [21], Copyright (2009)

