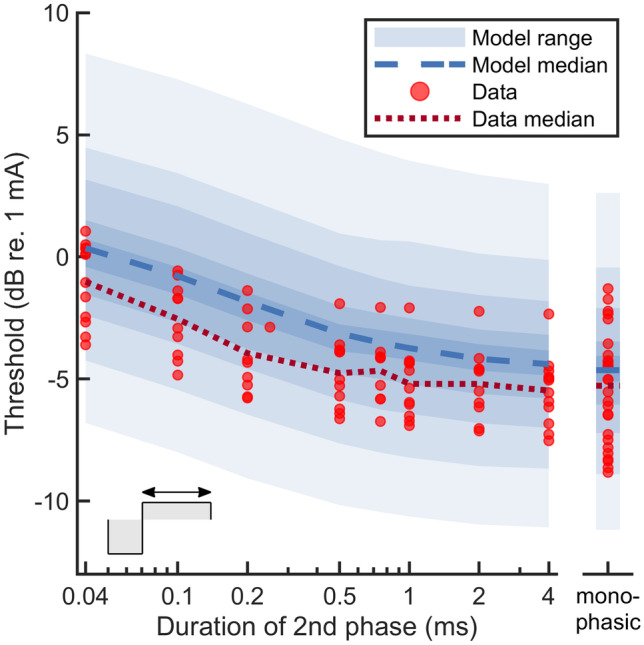
Fig. 9.

Effect of second-phase duration on single fiber thresholds. The cathodic leading phase had a duration of 40 µs and the amplitude of the anodic phase was adjusted to deliver a net charge of zero. The predicted range (shaded area) and median (blue dashed line) of the ANF population is compared to experimental data of Miller et al. [57] (red circles and dotted line). The different shades of blue indicate quantiles of the simulated data in 11.1 % steps
