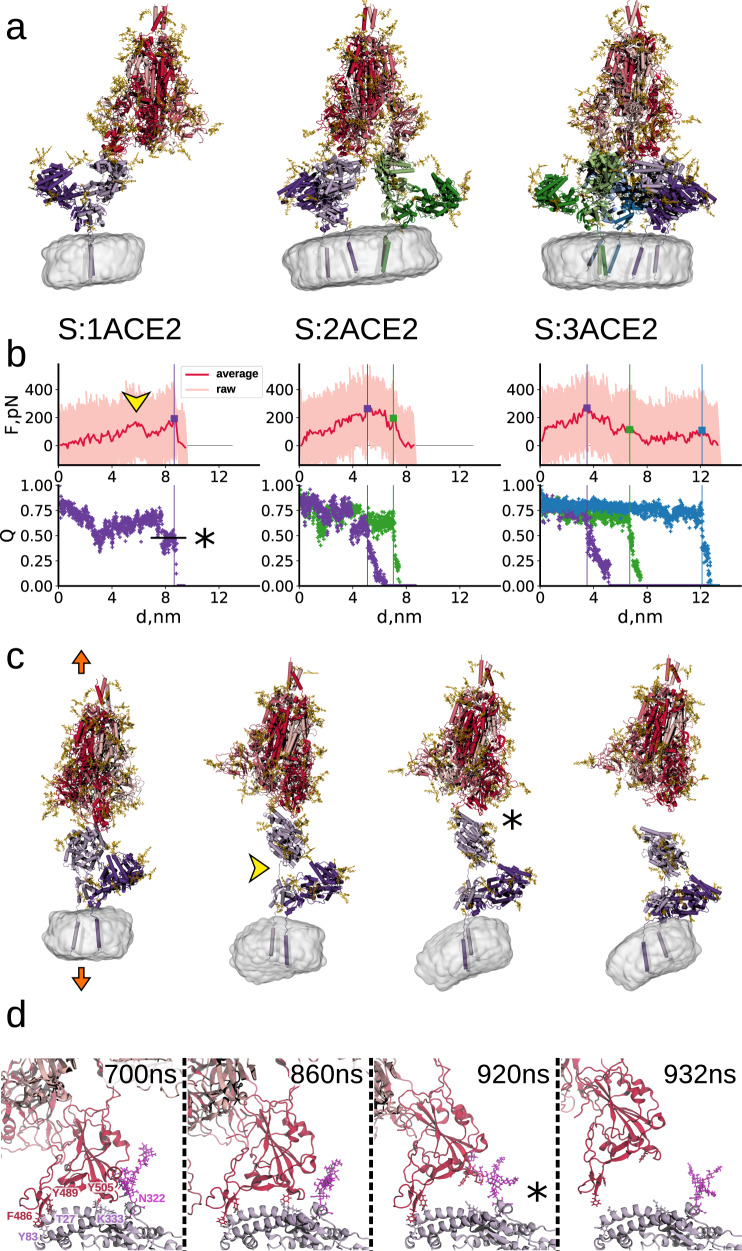
Fig. 3. Constant velocity pulling simulations of Spike:ACE2 complexes.
a Simulations of one, two, and three dimeric ACE2 receptors (left to right; shades of violet, green, blue; intracellular domain not shown) bound to a single Spike trimer (shades of red). The nanodisc membrane is shown in gray. Glycans on Spike and ACE2 are shown as gold sticks. b Force-extension (d) curves (top; 10-ns window average in solid red, raw data in pink) and fraction Q of Spike:ACE2 contacts (bottom). Vertical lines, yellow arrow, and star indicate dissociation events, the partial unfolding of the ACE2 linker domain, and the intermediate state with ~50% of the contacts, respectively. c Snapshots from the Spike:ACE2 simulation at a force loading rate of 0.0166 N/s (orange arrows, other symbols as in b left) until detachment (right). d Zoom-in on the Spike:ACE2 interface of (c). Key residues are indicated in red (RBD) and violet (ACE2, including its N322 glycan involved in RBD binding). The asterisk indicates the intermediate state of (b) and (c). Source data are provided as a Source Data file.

