
FIGURE 2.
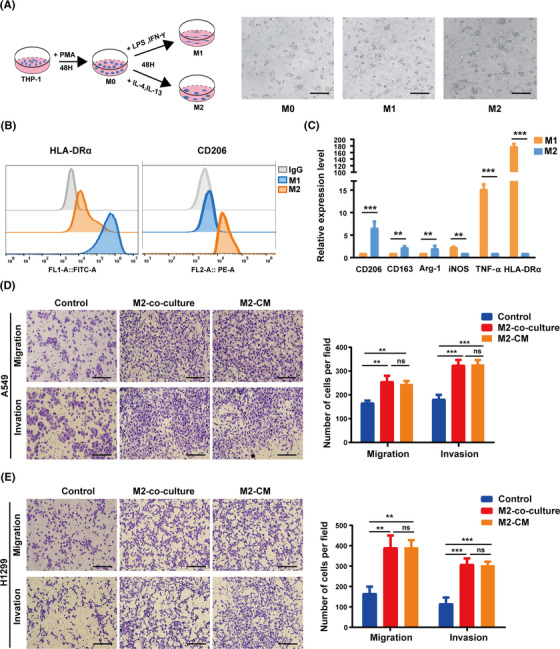
M2‐like macrophages enhance non‐small‐cell lung cancer (NSCLC) cell migration and invasion. (A) Schematic diagram of induced M1‐ or M2‐like macrophages from THP‐1 monocytes. Scale bar, 200 μm. (B) HLA‐DRα/CD206 flow cytometry markers were used to identify M1‐ or M2‐like macrophages. (C) The gene expression levels of M1‐ and M2‐like macrophages were validated by real‐time PCR assays. (D and E) The migration and invasion capacity of cancer cells were determined using Transwell assays after A549 and H1299 cells were cocultured with M2‐like macrophages or pretreated with conditioned media from M2‐like macrophages for 24 h. The left panel shows representative images, whereas the right panel shows migrating cell counts. Scale bar, 150 μm. The previous experiments were repeated at least three times to ensure the accuracy of the data. All data are presented as the means ± SEMs. Arg‐1, arginase 1; HLA‐DRα, major histocompatibility complex, class II, DR alpha; iNOS, inducible nitric oxide synthase; PMA, phorbol‐12‐myristate‐13 acetate; TNF‐α, tumor necrosis factor‐α. *p < 0.05, **p < 0.01, ***p < 0.001