
FIGURE 4.
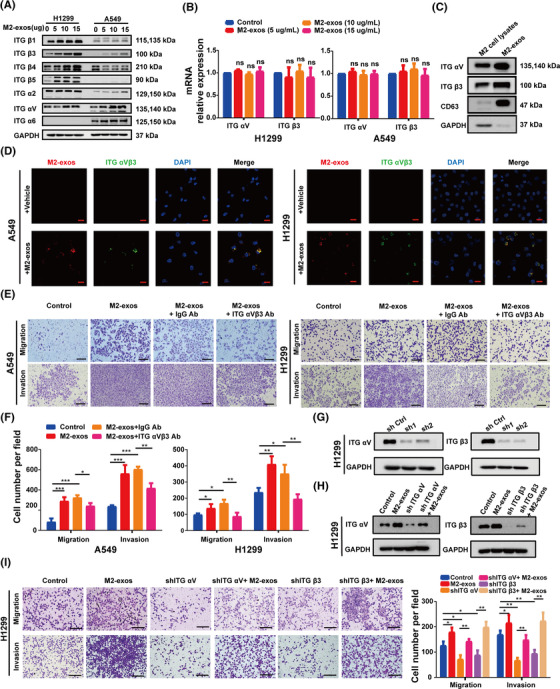
ITG αVβ3 is abundant in M2‐like macrophage‐derived exosomes (M2‐exos) and plays an important role in non‐small‐cell lung cancer (NSCLC) metastasis. (A) After treatment with different concentrations of M2 exos, Western blot analysis of ITG β1, β3, β4, β5, ITG α2, αV, and α6 protein levels in A549 and H1299 cells was performed. (B) Real‐time PCR assays were used to examine the mRNA expression levels of ITG αV and β3 in H1299 cells after treatment with various concentrations of M2‐exos. (C) Western blot of ITG αVβ3 protein levels in M2‐like macrophage whole‐cell lysates and M2‐exos. (D) Representative images of the internalization of M2‐exos (red) containing ITG αVβ3 (green) in H1299 cells. Scale bar, 20 μm. (E and F) A549 and H1299 cells were pretreated with phosphate buffered saline (PBS) (control), M2‐exos, M2‐exos+anti‐IgG blocking Ab or M2‐exos+anti‐ITG αVβ3 blocking Ab for 24 h, and the migration and invasion capacities of cancer cells were detected using Transwell assays. The left panel shows representative images, whereas the right panel shows migrating cell counts. Scale bar, 150 μm. (G and H) The efficacy of ITG αV/β3 silencing by shRNAs was confirmed by Western blot experiments. (I) Transwell assays evaluated the migration and invasion ability of normal H1299 cells or ITG αV‐ and β3‐silenced counterparts treated with or without M2‐exos. The left panel shows representative images, whereas the right panel shows migrating cell counts. Scale bar, 150 μm. The previous experiments were repeated at least three times to ensure the accuracy of the data. All data are presented as the means ± SEMs. ITG α2, integrin α2; ITG α6, integrin α6; ITG αV, integrin αV; ITG αVβ3 Ab, ITG αVβ3 blocking antibody; ITG β1, integrin β1; ITG β3, integrin β3; ITG β4, integrin β4; ITG β5, integrin β5. *p < 0.05, **p < 0.01, ***p < 0.001