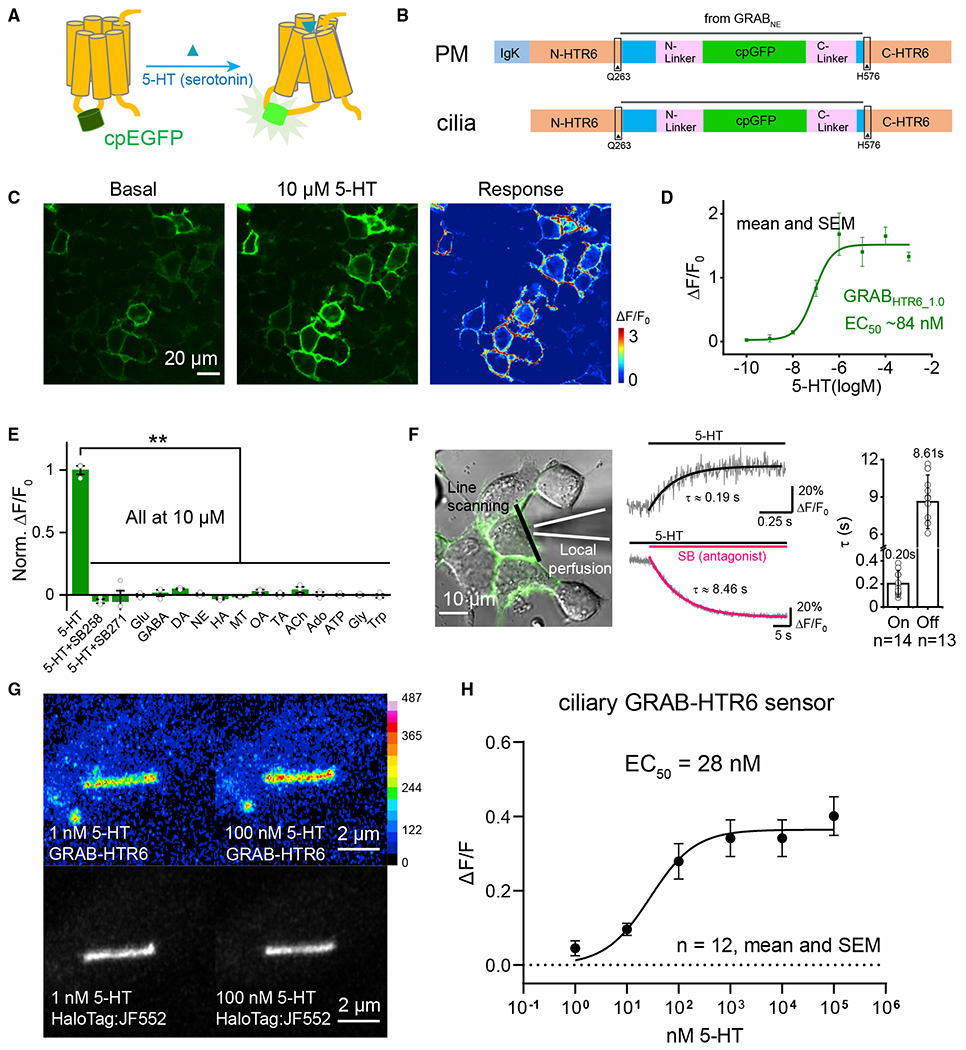
Figure 3. Engineering a 5-HTR6 receptor cilia-targeted sensor.

(A) A circularly permutated EGFP (cpEGFP) was inserted into the 3rd intracytoplasmic loop of 5-HTR6. Upon ligand binding, a conformational change of the receptor increases EGFP fluorescence.
(B) Schematic diagrams of GRAB-HTR6-PM (top) and GRAB-HTR6-cilia (bottom).
(C) Representative images show the expression of the GRAB-HTR6-PM sensor (left, no 5-HT; middle, 10 μM 5-HT) and the response (right).
(D) Dose-response curve of the GRAB-HTR6-PM sensor.
(E) Summary of ΔF/F0 measured in GRAB-HTR6-PM-expressing HEK293T cells in response to 10 μM 5-HT, 5-HT with 5-HTR6 antagonist SB 258585 (SB258), or SB 271046 (SB271). ACh, acetylcholine; Ado, adenosine; ATP, adenosine 5′-triphosphate; DA, dopamine; GABA, gamma-aminobutyric acid; Glu, glutamate; Gly, glycine; HA, histamine; MT, melatonin; NE, norepinephrine; OA, octopamine; TA, tyramine;Trp, tryptophan. ΔF/F0 was normalized to the averaged peak response measured in 5-HT. Two-tailed Student’s t tests, **p < 0.01.
(F) Kinetics of the GRAB-HTR6-PM sensor. Left: a local perfusion system with high-speed line scanning measuring the fluorescence response. Middle: traces of GRAB-HTR6-PM fluorescence in response to 100 μM 5-HT (top) or 100 μM SB 271046 in the continued presence of 1 μM 5-HT (bottom). Right: on- and off-kinetic group data.
(G) RPE-1 cells stably expressing a Tet-inducible HTR6-GRAB-cilia-HaloTag. 100-nM application results in increased GFP fluorescence. HaloTag: JF552 was used to reliably identify cilia.
(H) Titration curve of the sensor. n = 3 wells, 300–500 cells/well for (D) and (E).
