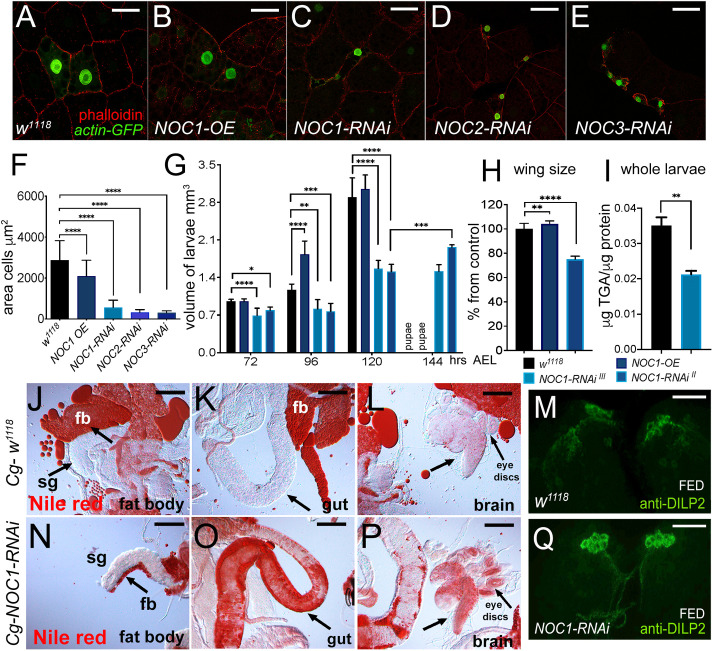
Fig. 5.
NOC1 downregulation in the FB reduces its size and TGA content resulting in larval lethality and induces dyslipidemia. (A–E) Confocal images of actin-flip-out clones in the FB co-expressing nuclear GFP together with the indicated transgenes. Phalloidin–Texas Red was used to mark cell membranes. (F) Quantification (mean±s.d.) of the size of the cells in the clones from the FB; data are from at least two independent experiments. (G) Analysis of larval volume measured at the indicated time of development until pupariation in animals in which the NOC transgenes were expressed using the Cg promoter. Data show one of three experiments using ten or more animals for each genotype. (H) Analysis of the wing size from 4-day-old female adult flies of the indicated genotypes, data are expressed as mean±s.d. percentage from control w1118. (I) Quantification mean±s.d. of triglyceride (TGA) levels in whole larvae at 120 h AEL, data are expressed as microgram of TGAs per microgram of proteins. Data in G–I are from at least two independent experiments. (J–L,N–P) Photographs of larval organs stained with Nile Red to visualized lipids from control w1118 (J–L) and NOC1-RNAi animals (N–P) at third instar. Reduction of NOC1-RNAi affects the size of the FB (fb) particularly visible near the salivary gland (sg indicated by the arrow). The impairment to accumulation of nutrients in the FB in NOC1-RNAi animals induces the storage of fats in other organs, visible in the gut, as indicated by the arrow in K and O, and in the brain and eye imaginal discs, indicated by the arrow in L and P. (M,Q) Confocal images of third-instar larval brains showing DILP2 immunostaining in the IPCs from control w1118 (M) and NOC1-RNAi (Q) animals in feeding conditions. *P<0.05; **P<0.01; ***P<0.001; ****P<0.0001 [one-way ANOVA with Tukey multi-comparisons test (F–H); Student's t-test (I)]. Images shown are representative of one out of at least three experiments. Scale bars: 50 µm (A–E,M,Q); 100 µm (J–L,N–P).

