Fig. 6.
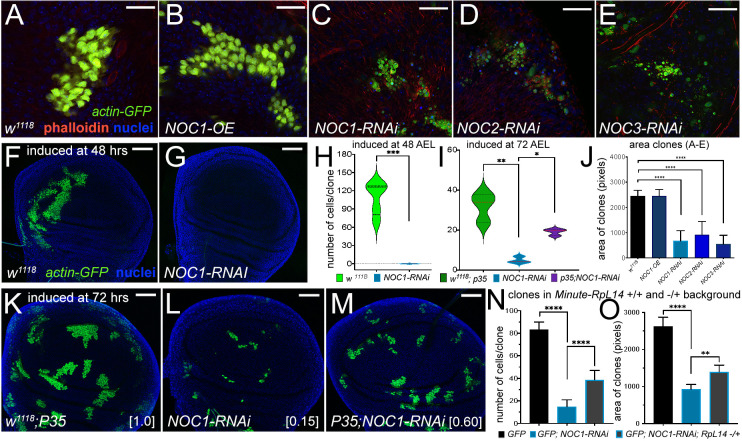
Reduction of NOC1, NOC2 and NOC3 in cells of the wing imaginal disc induces growth defects that are rescued by co-expressing P35 and in a Minute(3)66D/+ heterozygous background. (A–E) Confocal images of actin-flip-out clones analyzed in the wing imaginal discs, expressing nuclear GFP and the indicated transgenes. Phalloidin–Texas Red was used to mark the cell membranes (red) and Hoechst for the nuclei (blue). (J) Quantification of clonal size performed by measuring the area marked by phalloidin; area is shown in pixels (mean±s.d.). At least 15 animals from each genotype were used. (F,G) Confocal images of wing imaginal discs showing actin-flip-out clones expressing GFP alone (F) or co-expressing NOC1-RNAi (G). Clones were induced at 48 h AEL. (H,I) Quantification of the number of cells in each clone was analyzed at 120 h AEL using GFP as marker presented as violin plots with median and interquartile range marked by dashed lines. (K–M) Photographs of actin-flip-out clones in wing discs expressing GFP along with the inhibitor of caspase P35 (K), or with NOC1-RNAi (L) or co-expressing NOC1-RNAi together with P35 (M); clones were induced at 72 h AEL. The number of cells in each clone from K, L and M was quantified at 120 h AEL. The total number of clones analyzed in this experiment is: w1118+P35 (72), NOC1-RNAi alone (66), and NOC1-RNAi+p35 (81). The numbers in square brackets represent the relative size of clones (average) compared to that from control considered equal to 1. (N,O) Analysis of cell number and clonal size of NOC1-RNAi clones induced in ribosomal protein (Rp)+/− and an Rp+/+ background using the Minute(3)66D/+ line that carries a mutation in the Rpl14 protein. (N) Quantification (mean±s.d.) of the number of clones in each disc. (O) Clonal size (mean±s.d.) showing that defects of NOC1-RNAi cells are partially rescued when clones are grown in the Minute(3)66D/+ (Rp+/−) background. *P<0.05, **P<0.01, ***P<0.001 and ****P<0.0001 [unpaired two-tailed Student's t-test (H); one-way ANOVA with Tukey multiple comparisons (I,J,N,O)]. In F,G,K–M, Hoechst was used for staining the nuclei. Scale bars: 20 µm (A–E); 50 µm (F,G,K–M).

