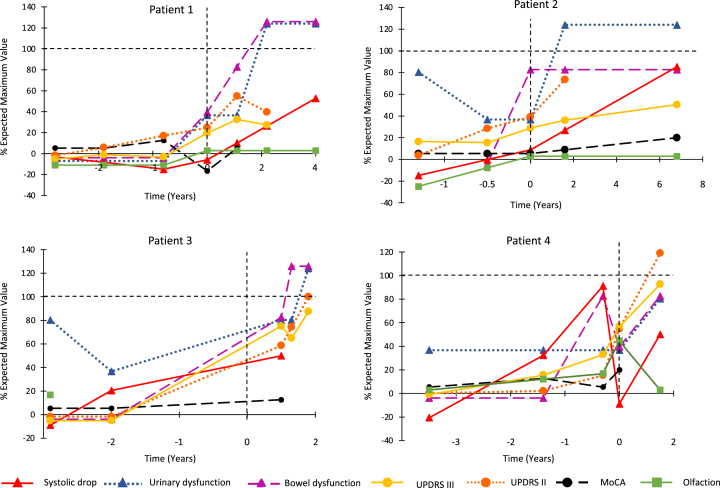
Fig. 1.
Combined progression trajectory of motor and non-motor manifestations from prodromal stages. For each marker, the 0 point is set as the normal control values, selected from our cohort study. The 100% indicates severe abnormality of the marker, as assessed as the worst 1 standard deviation of patients with advanced Parkinson’s disease and RBD, taken from a previous study [31].

