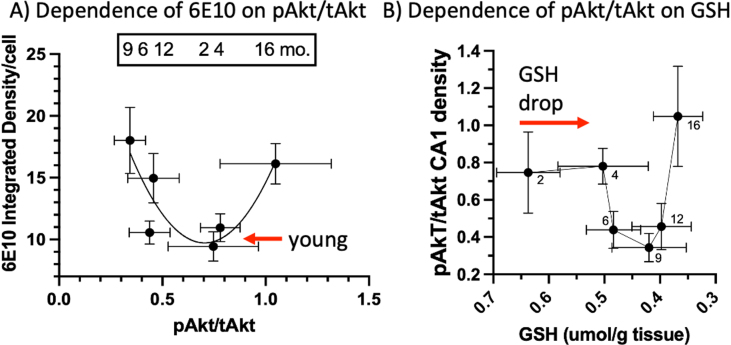
Fig. 5.
U-shaped correlations of pAkt/tAkt with 6E10 Aβ and GSH. A) Mid-range pAkt/tAkt correlates with low intracellular CA1 6E10 while declines or elevations in this ratio correlate with higher 6E10 levels. B) Before a change in pAkt/tAkt ratios, GSH drops 23% from 2 to 4 months followed by a decline in pAkt/tAkt, then a rise in ratio as GSH declines further (reverse scale).

