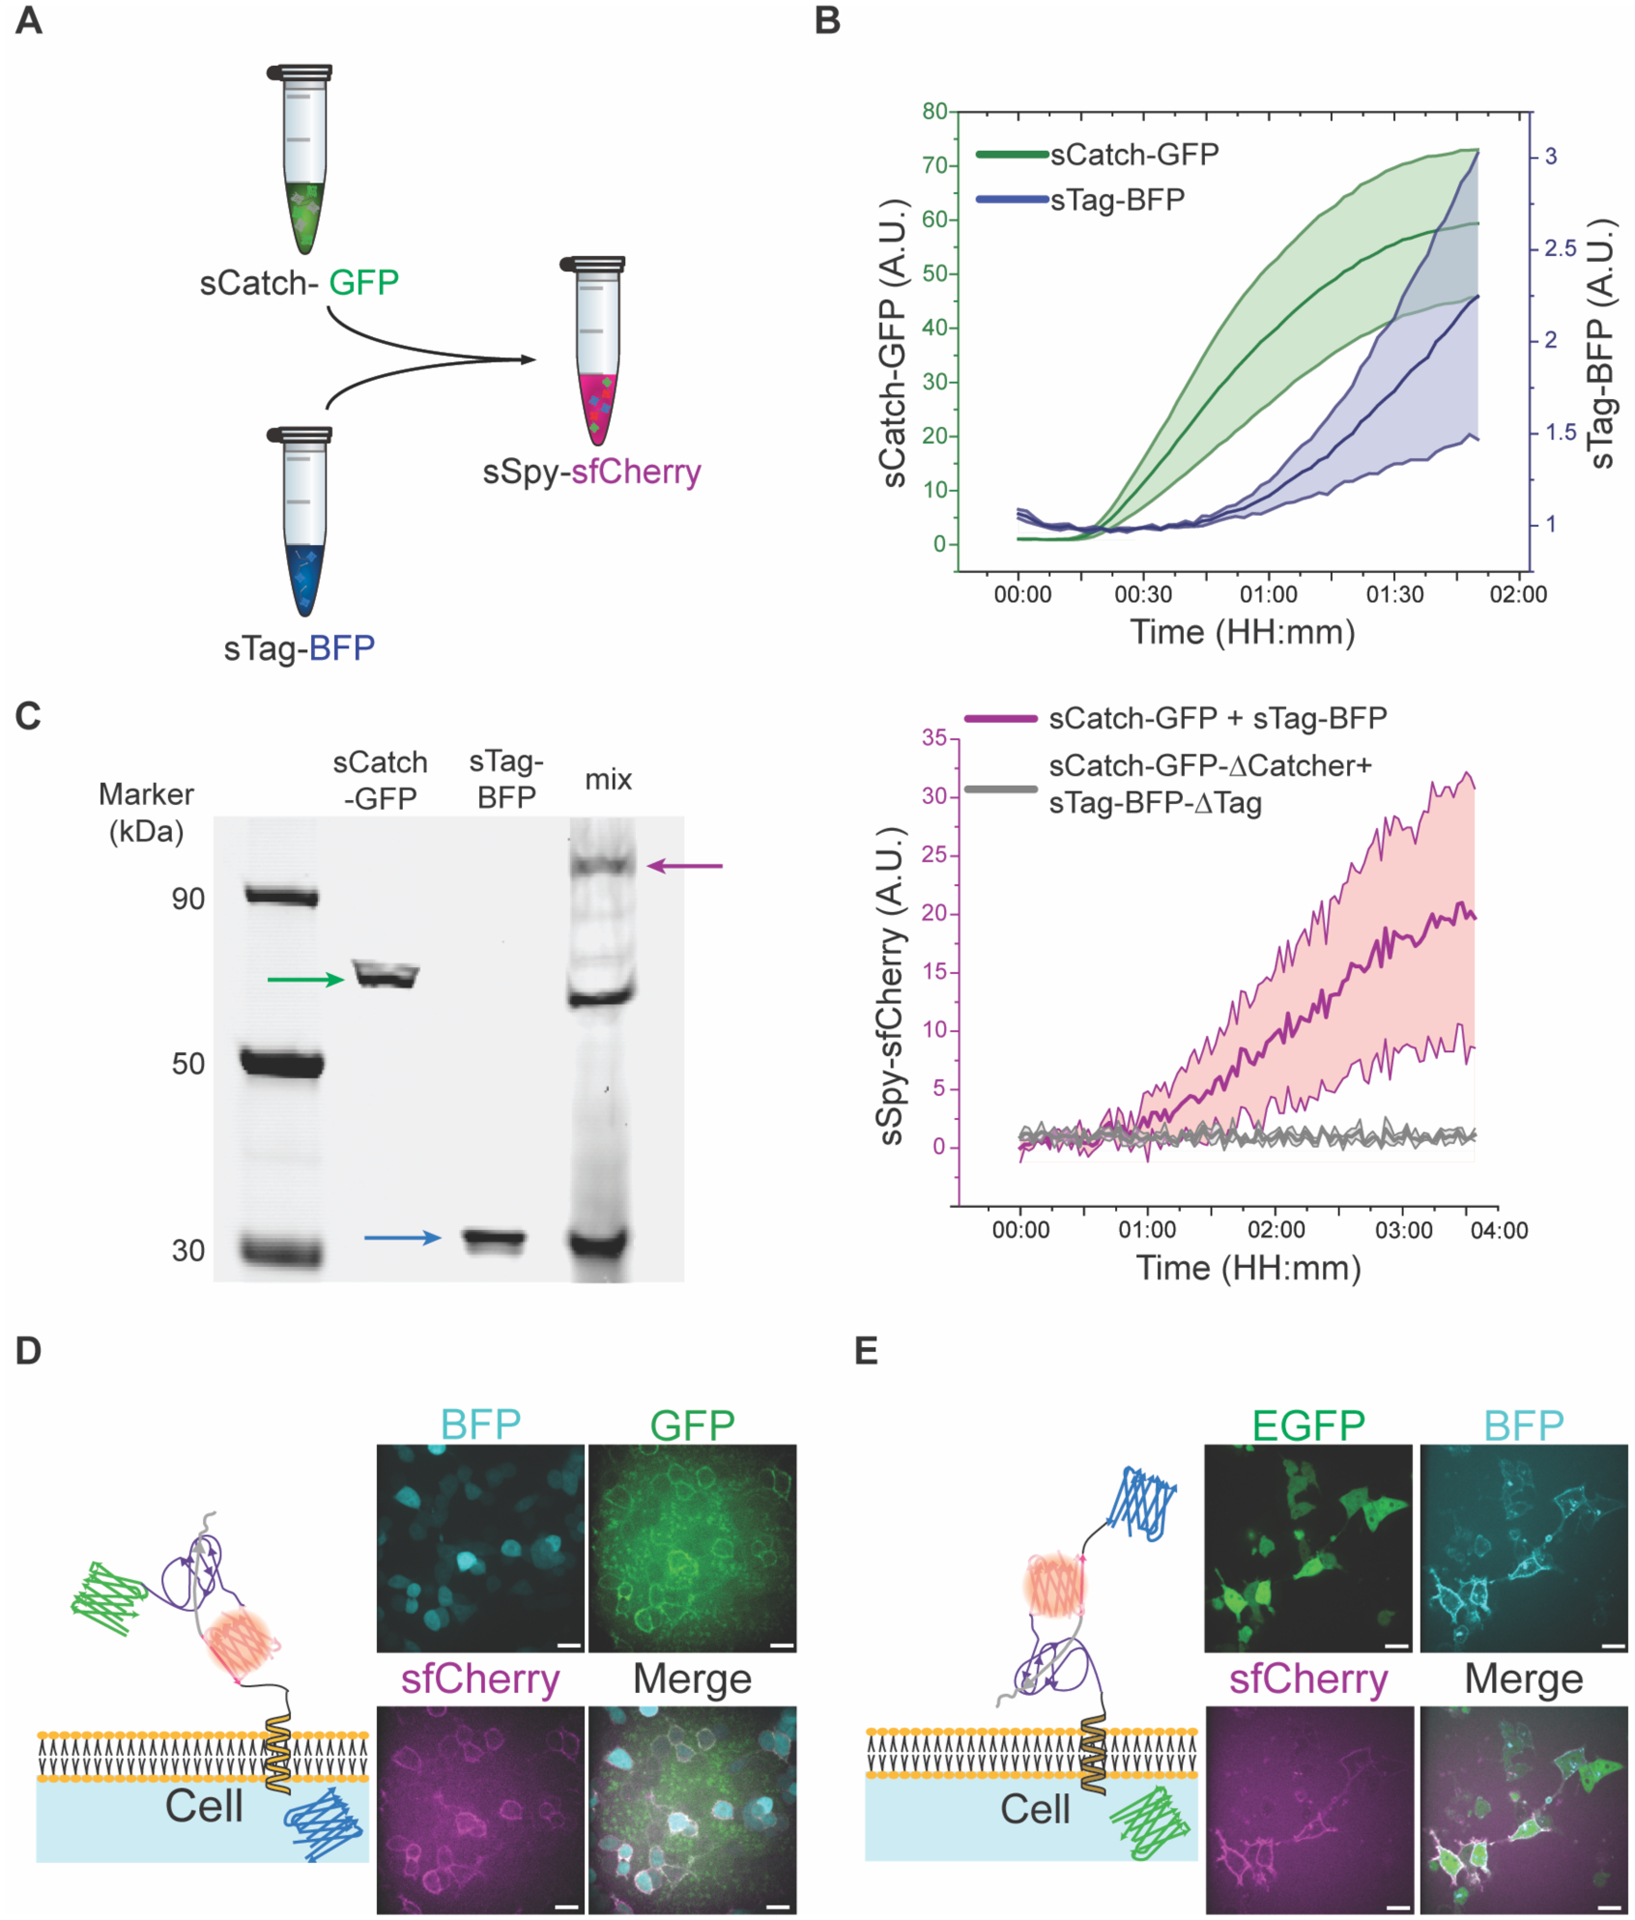
Figure 2:

sTag-BFP and sCatch-GFP expressed through the CFE system are functionally reconstituted in vitro. A) Schematic representation of in vitro reconstitution of sfCherry through interaction of sCatch-GFP and sTag-BFP. sCatch-GFP and sTag-BFP are synthesized in a cell-free system via coupled transcription-translation. B) Translation of sCatch-GFP (green) and sTag-BFP (blue) during cell-free protein synthesis reactions were tracked through fluorescence readouts. Data shown as mean ± SD, n=3. C) Left: In-gel fluorescence imaging of ladder (Lane 1), sCatch-GFP (Lane 2), sTag-BFP (Lane 3), and a mixture of sTag-BFP and sCatch-GFP (Lane 4). The signals of GFP and BODIPY-FL lysine indicated protein bands for full-length expression of sCatch-GFP (Lane 2, green arrow) and sTag-BFP (Lane 3, blue arrow), respectively. When two proteins were mixed, a protein band around 90 kDa appeared (Lane 4, red arrow). Right: (Red) Fluorescence readout of reconstituted sfCherry upon mixing sTag-BFP and sCatch-GFP. (Gray) Fluorescence readout from a control experiment where sCatch-GFP-ΔCatcher and sTag-BFP-ΔTag were mixed. Data shown as mean ± SD, n=3. D) Representative confocal images of reconstituted sfCherry (magenta) through addition of sCatch-GFP (green) to HEK293T cells displaying InterTag on their plasma membrane identified by BFP (cyan) cytoplasmic expression. Also shown is the schematic of reconstituted sfCherry through interaction of SpyTag/SpyCatcher at the membrane. E) Representative confocal images of sfCherry (magenta) reconstitution by addition of cell-free synthesized sTag-BFP (cyan) to HEK293T cells expressing InterCatch at the membrane identified by EGFP (green) cytoplasmic expression. Scale bars: 20 μm.
