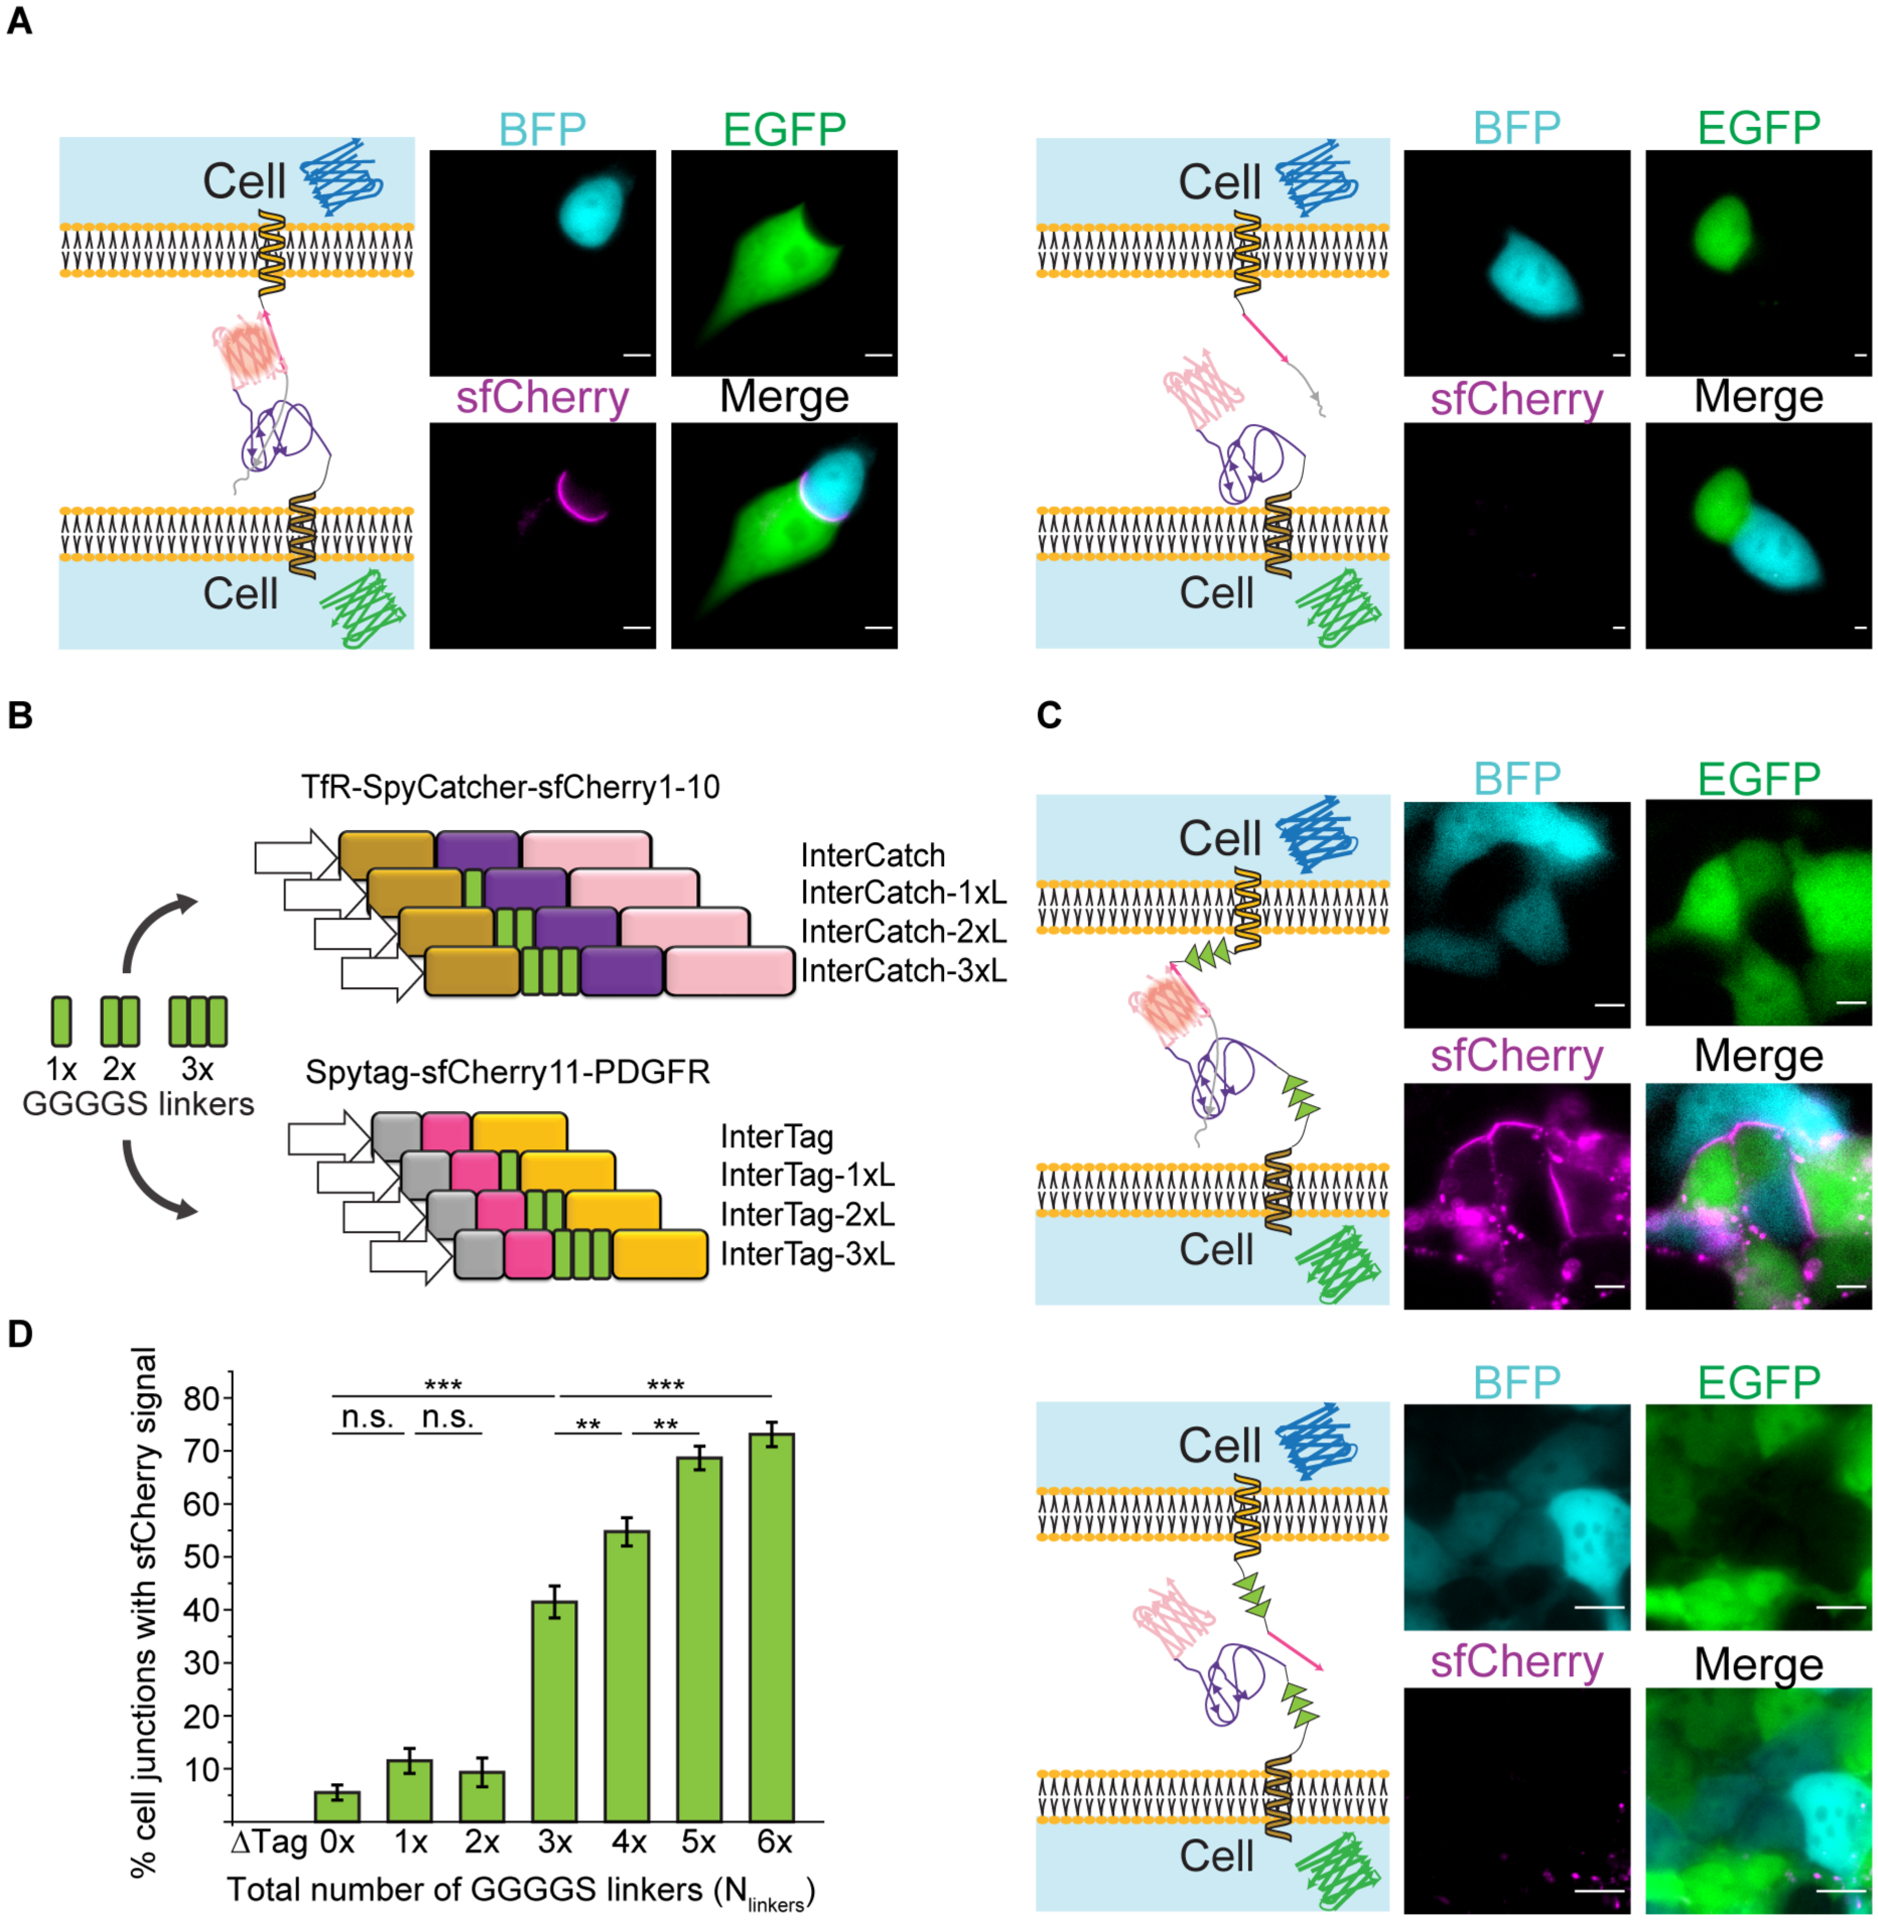
Figure 5:

Effect of number of GGGGS linkers in the InterSpy system on the efficiency of reconstitution of sfCherry fluorescence. A) Left: Representative single cell image of InterSpy-0xL (sfCherry, magenta) reconstituted through InterTag-0xL (BFP, cyan) and InterCatch-0xL (EGFP, green). Right: A representative single cell image of unsuccessful reconstitution of InterSpy-0xL (sfCherry). Corresponding representative images of cells expressing InterTag-0xL (BFP, cyan) and InterCatch-0xL (EGFP, green) are also shown. B) Schematic representation of a mini-library of InterTag and InterCatch constituting different numbers of GGGGS linkers. C) Top: Representative cell cohort image of reconstituted InterSpy-6xL (sfCherry, magenta) with InterTag-3xL (BFP, cyan) and InterCatch-3xL (EGFP, green). Bottom: Representative cell cohort image showing lack of sfCherry signal upon interaction of InterTag-3xL-ΔTag (BFP, cyan) and InterCatch-3xL (EGFP, green). All scale bars are 5 μm. D) Plot showing percent of cell-cell junctions with reconstituted sfCherry signal vs. total number of intercellular GGGGS linkers (Nlinkers). Data presented as mean ± SD across experiments performed for co-cultured cell line pairs expressing the same total number of GGGGS linkers. E.g. co-cultured cell pairs expressing InterTag-0xL + InterCatch-3xL, InterTag-1xL + InterCatch-2xL, InterTag-2xL + InterCatch-1xL, and InterTag-3xL + InterCatch-0xL contribute to the histogram for a total of 3 GGGGS linkers. For every co-cultured cell pair type, three independent experiments were performed. The number of intercellular junctions (N) that are included for evaluation of successful sfCherry reconstitutions from linker total = 0 to 6 are 254, 183, 118, 275, 347, 433 and 372, respectively. p-values are calculated using Fisher’s exact test with Bonferroni correction. n.s. denotes not significant. **, and *** represent p < 0.01, and p < 0.001, respectively.
