Fig. 1.
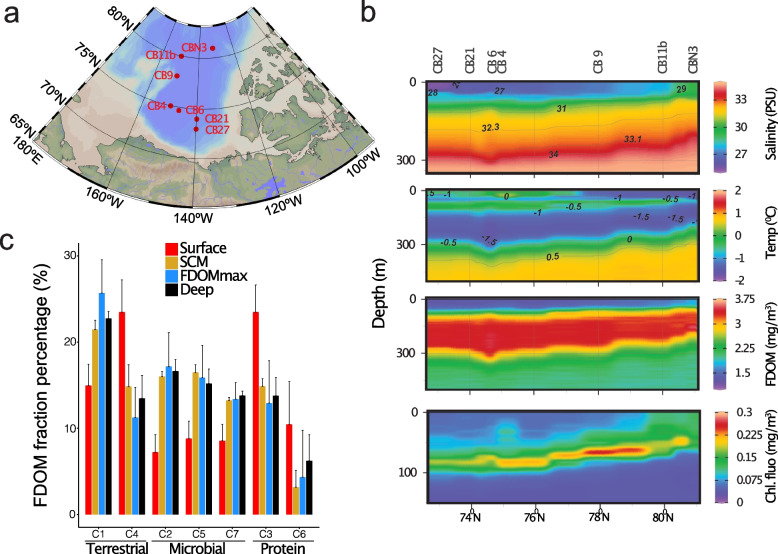
Spatial biogeochemistry of the Canada Basin. a Map of the 7 stations sampled in this study. b Depth profile of salinity (PSU), temperature (°C), fluorescent dissolved organic matter (FDOM, mg/m3), and chlorophyll fluorescence (mg/m3) at the 8 stations sampled in this study. c Percentage of the 7 FDOM fractions identified using excitation emission matrix fluorescence spectroscopy combined with parallel factor analysis. Samples are grouped in 4 samples water features: surface, subsurface chlorophyll maximum (SCM), fluorescent dissolved organic matter maximum (FDOMmax), and deep waters

