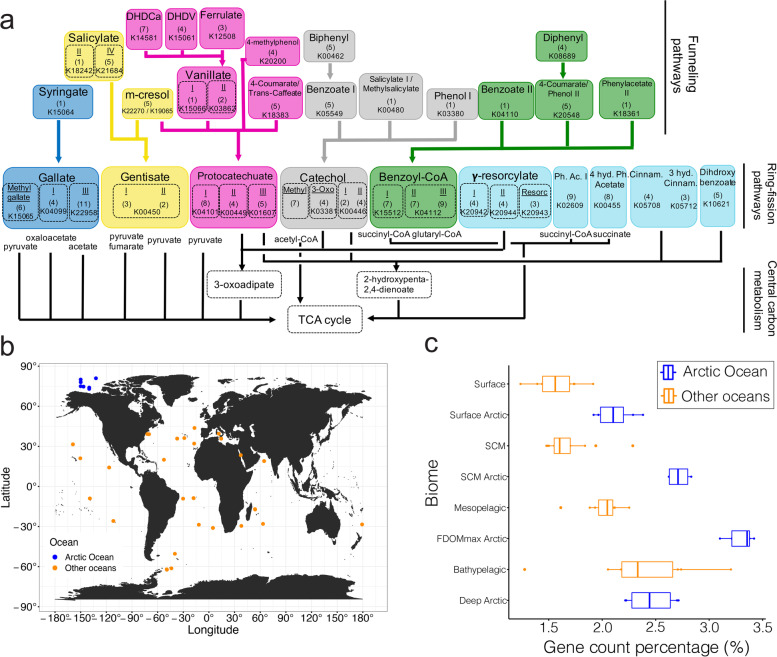
Fig. 3.
a Diagram of the 46 funneling and ring-opening pathways involved in the degradation of lignin-derived aromatic compounds. b Map of the metagenomic samples used to compare the capacity to degrade aromatic compounds in the Arctic Ocean (blue) compared to other seas and oceans (orange). c Fraction of metabolic genes involved in the degradation of aromatic compounds in the Arctic Ocean (blue) and other seas and oceans (orange). The line in the box represents the median. The left and right hinges of the box represent the 25th and 75th percentiles. Whiskers extend to the smallest and largest values (no further than 1.5× the interquartile range)

