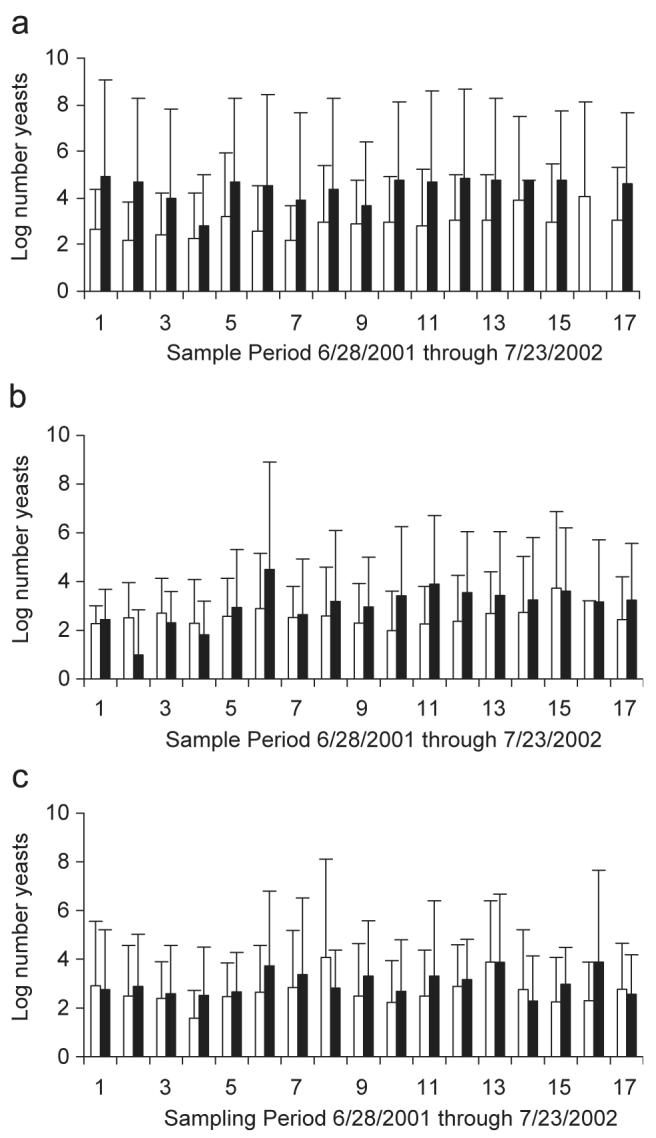
Fig. 1.

Number of yeasts (log10) per 100 g of sand (CFU) at Hobie Beach (top), Fort Lauderdale Beach (middle) and Hollywood Beach (bottom). Data as means (n = 3) with S.E. Open bars are wet sand samples; black bars are dry sand samples. Samples were collected between August 2001 and July 2002 every 2–3 weeks (specific sampling dates [1–17] given in Section 2).
