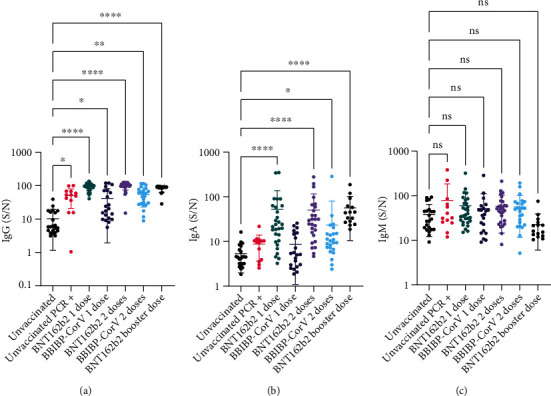
Figure 1.

Measurement of anti-RBD IgG, IgA, and IgM. Participants were divided by their vaccination status, type of vaccine, and dose of vaccine. Serum samples were incubated with RBD-coated plates; subsequently, HRP-tagged anti-human IgG, IgA, or IgM antibodies were used to detect the presence of bound IgG, IgA, and IgM, respectively. (S/N) represents the chemiluminescence signal generated from wells incubated with 1% serum divided by the signal in control wells incubated with PBST. (a) Represents anti-RBD IgG levels while (b) represents anti-RBD IgA levels, and (c) represents anti-RBD IgM levels. Bold horizontal lines represent the mean of each group, while whiskers represent the standard deviation. Some error bars were clipped at the axis limit. Dunn's multiple comparisons statistical test following Kruskal–Wallis test was used to compare various groups to the unvaccinated group. ns P > 0.05, ∗P ≤ 0.05, ∗∗P ≤ 0.01, ∗∗∗∗P ≤ 0.0001.
