Figure 2.

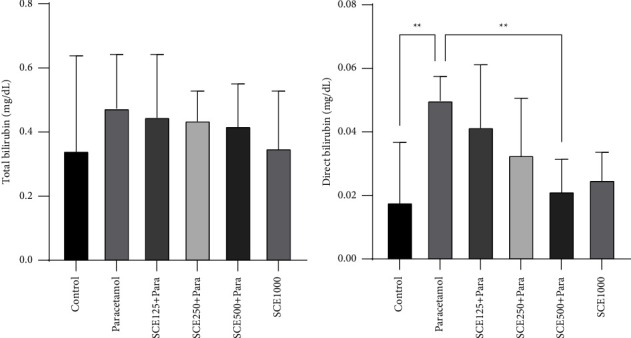
Comparison of total bilirubin and direct bilirubin among all groups. ∗∗P < 0.001: significant compared to the paracetamol group; number of mice per group = 8.

Comparison of total bilirubin and direct bilirubin among all groups. ∗∗P < 0.001: significant compared to the paracetamol group; number of mice per group = 8.