

Abstract
Peroxidases are oxidoreductase enzymes that widely gained attention as biocatalysts for their robust catalytic activity, specificity, and regioselective functionality for phenolic compounds. The study of molecular aspects of peroxidases is as crucial as that of the physicochemical aspects. A bioinformatics approach is utilized in this study to investigate the structural aspects and functions of luffa peroxidase (LPrx) from Luffa acutangula. The evolutionary relationship of LPrx with other class III peroxidases was studied by constructing a neighbour-joining phylogenetic tree. An analysis of the phylogenetic tree revealed that plant peroxidases share a common ancestor. The gene ontology term showed that LPrx had a molecular functionality of the oxidation–reduction process, heme binding and peroxidase-like activity, and the biological function of hydrogen peroxide scavenging activity. The enzyme-ligand interactions were studied from a catalytic point of view using the molecular docking technique. The molecular docking was carried out with LPrx as a receptor and guaiacol, m-cresol, p-cresol, catechol, quinol, pyrogallol, 2,4-dimethoxyphenol, gallic acid, aniline, and o-phenylenediamine as ligands. The results presented in the current communication will have a significant implication in proteomics, biochemistry, biotechnology, and the potential applications of peroxidases in the biotransformations of organic compounds.
Supplementary Information
The online version contains supplementary material available at 10.1007/s13205-022-03432-8.
Keywords: Peroxidase, Homology modelling, Phylogenesis, Molecular docking, Gene ontology, Enzyme functions
Introduction
Computational characterisation plays a vital role in analysing protein structures and functionality of peroxidases. Research in bioinformatics of enzymes has been spurred and intensified by the development of advanced tools like Basic Local Alignment Search Tool (BLAST), Fast Alignment Sequence Test (FASTA), RasMol, PyRx, AutoDock Vina, Discovery Studio, CDOCKER, and others. The availability of well-classified data and well-annotated sequences of peroxidases present in the depository/data bank has significantly helped perform global analyses and advances in the study of peroxidases. All protein sequencing and structural data of peroxidases are stored in the National Centre for Biotechnology Application (NCBI) (https://www.ncbi.nlm.nih.gov/), and Research Collaboratory for Structural Bioinformatics Protein Databank (RCSB PDB) (https://www.rcsb.org) and can be accessed freely worldwide for institutional/academic purposes. Recently, in bioinformatic analysis of peroxidases, emphasis has been given to protein characterisation, functionality and functional domain identification, protein structure prediction, statistical modelling of protein–protein interactions, and gene classification and expression (Kumar et al. 2021, 2022; Singh et al. 2021b, 2022b, c, d).
Peroxidases are groups of heme-containing or non-heme containing oxidoreduction enzymes found in all living organisms. Recently, plant-based peroxidases have gained wide attention for their potential application as a robust biocatalyst in the oxidation and reduction of organic or inorganic substrates in the presence of hydrogen peroxide or organic peroxides. Plant peroxidases are mainly classified as extracellular class III, and they play a fundamental role in all tissues and the life cycle of the plant kingdom. Horseradish peroxidase has been extensively studied, but other plant sources have also gained attention. The role of peroxidase in plants includes H2O2 scavenging, detoxifying contaminants, cell wall metabolism, lignification, suberisation, auxin catabolism, defence against pathogen attacks, wound healing, and catalysing the biochemical synthesis (Pandey et al. 2017). Recently peroxidases have been widely employed as a biocatalyst in the biotransformation of hazardous organic compounds into less toxic compounds. They have been extensively used in degrading phenols, aromatic amines, dyes, pesticides, and pharmaceutical compounds. Biotechnological applications include biosensors and immunoassays for detecting persistent organic pollutants, food allergens, and heavy metal ions such as Zn2+, Hg2+, Cd2+, and Pb2+ (Nomngongo et al. 2011; Moyo 2014; Moyo and Okonkwo 2014; Cai et al. 2015; Morsi et al. 2020). Plant peroxidases are now the most studied and valuable enzymes due to their diverse applications in organic synthesis, pharmaceuticals, and biotechnology.
The major components of peroxidases are amino acid residues, prostatic groups and metal atoms. They contain 200–800 amino acid residues, and their molecular weight ranges from 30 to 150 kDa. Peroxidases have two different types of metal centres. Heme containing peroxidases contains heme b as a prostatic group and two distal and proximal Ca2+ ions. The structure of peroxidase was first studied from HRP and its isoenzymes. It consisted of 308 amino acids, two calcium atoms, heme b (iron (III) protoporphyrin IX), and 4 disulfide bridges between cysteine residues 11–91, 44–49, 97–301, and 177–209, and a buried salt bridge between Asp99 and Arg123 (Veitch 2004). The 3D structure of HRP and heme b is presented in Fig. 1. The heme b of peroxidase lies between the distal and proximal domains of the structure. Hydrogen bonds coupled the distal pocket to the proximal through Arg 38. His 170 was found covalently bonded to the iron of the heme group. The centre, Fe (III) ion, was a mixture of five coordinated and six coordinated high spin states, where the five coordinated dominated the structure. Hydrogen bonds were observed between the heme group and amino acid residues Gln 176, Ser 73, Ser 35, and Arg 31. Two Ca2+ were observed in the same relative position with respect to the heme group. Both the distal and proximal Ca2+ ions active sites were found to have seven coordinates. The proximal His of heme b was indirectly coupled to the proximal Ca2+ through the side chain of an adjacent residue, Thr 171. Nine glycosylation sites were identified in the structure. All the glycosylation sites in the structure were pointed away from the molecule and evenly distributed over the entire molecular surface.
Fig. 1.

3 D structure of horseradish peroxidase (Berglund et al. 2002) and active site of heme b
A wide range of different protein structures of plant-based enzymes has been reported worldwide. The bioinformatics tools have proven to be very handy in characterising peroxidases from rice plants (Singh and Shah 2014), papaya (Pandey et al. 2013), Coprinus cinereus (Kim et al. 2010), Arabindo thalinia (Herrero et al. 2013), Trachycarpus fortunei (Baker et al. 2014) and other thousands of well-identified plant species. In the study of molecular interaction of enzyme catalysis, powerful approach like molecular docking has enabled more realistic protein–ligand docking experiments. It provides valuable information for understanding the amino acid residues of the enzyme involved in binding the ligand molecules, different types of interaction, substrate specificity, and different conformations of the enzymes (Kumar et al. 2021).
In this communication, we adopted well-established computational approaches to present the in silico study of luffa peroxidase (LPrx) from the novel source Luffa acutangula. Several plant peroxidases like horseradish peroxidase, soybean peroxidase, radish peroxidase, and cabbage peroxidase have been well characterised, but LPrx has not yet been characterised and annotated. Here, we decode the protein structure and functional characteristics of LPrx. The important physical and chemical properties, such as the number of amino acid residues, molecular weight, isoelectric point, aliphatic index, and the interactions between enzyme and ligand molecules, were thoroughly investigated. The major gene ontology terms—molecular functions, biological functions, and cellular components—were illustrated with the help of a gene ontology database and resources available on the internet. The interactions of LPrx with ligands presented in Table 7 were also thoroughly investigated with a molecular docking technique.
Table 7.
List of ligands used for the study of enzyme-ligand interactions

Materials and methods
MALDI-TOF MS analysis
The MALDI-TOF MS analysis was carried out according to the method described by Webster et al. (Webster and Oxley 2012). The protein was purified first and the data of LPrx purification is available at https://data.mendeley.com/datasets/67575wmkd6/draft?a=35d4acdd-647c-40cf-b249-3dd6d8c5faba. The purification steps involved extraction of the enzyme from a source Luffa acuntagula, protein concentration by ammonium sulphate precipitation, dialysis, ion-exchange chromatography, and SDS-PAGE analysis. A purified protein band was cut from SDS-PAGE gel and destained with deionized distilled water. The gel piece was transferred into eppendorf tube and filled with distilled water. For the digestion of the protein sample, the distilled water was removed from the eppendorf tube containing the protein gel piece, and 10.0 µL of 10 × trypsin stock solution and 90 µL of aqueous buffer were added and mixed properly. A gel piece was rehydrated for 10 min, and the excess liquid was removed from the tube. Then, 1.0 ml of aqueous buffer was added and incubated overnight at 37 °C. After the incubation, 1/10th volume of 10 % trifluoroacetic acid (TFA) was added and sonicated for 5 min. The resulting supernatant was directly used for the MALDI TOF MS analysis.
For the generation of MALDI TOF MS data, the matrix solution of 0.5 µL was applied to a clean MALDI plate and allowed to dry. Then 1 µL of the digested protein sample was applied to the dried matrix spot and dried in the air. A 5.0 µL of 0.1% TFA solution was applied to the sample spot and left for 30 s to remove the salt. This step was repeated several times. The peptide mass was then recorded in the mass range of m/z 600–3500 by setting the number of shots at 100 and the low laser power. The laser power was gradually increased until a satisfactory signal level was obtained in the mass spectrum. The data were analysed using the MASCOT tool (https://www.matrixscience.com/) associated with the instrument (Thiede et al. 2005).
Protein sequence retrieval
The amino acid sequence of plant-based peroxidases was retrieved from the National Center for Biotechnology Information (NCBI) database (https://www.ncbi.nlm.nih.gov/) using a protein–protein BLAST (Basic local alignment search tool) in FASTA (Fast adaptive shrinkage threshold algorithm) format. The sequences with high significance alignments to the query sequence were selected based on their max score, total score, query cover, E value, per cent identity, and accession length. A total of 26 amino acid sequences of plant peroxidases, including the target sequence with a pair identity > 90% (presented in Table 4), were selected so that the data will have significance upon in silico analysis. The number of amino acid residues of all plant species was > 300.
Table 4.
List of plant-based peroxidase
| Sl No | Genus | Name of the species | Family | Accession number | Number of amino acid residues | Pair identity (%) |
|---|---|---|---|---|---|---|
| 1 | Luffa | Luffa acutangula | Cucurbitaceae | Query sequence | 332 | – |
| 2 | Cucumis | Cucumis melo var. makuwa | Cucurbitaceae | KAA0056856.1 | 331 | 97.39 |
| 3 | Cucumis | Cucumis melo | Cucurbitaceae | XP_008441087.1 | 331 | 97.07 |
| 4 | Cucumis | Cucumis sativus | Cucurbitaceae | XP_004145112.1 | 331 | 97.72 |
| 5 | Benincasa | Benincasa hispida | Cucurbitaceae | XP_038894584.1 | 331 | 96.74 |
| 6 | Momordica | Momordica charantia | Cucurbitaceae | XP_022140003.1 | 331 | 97.72 |
| 7 | Luffa | Luffa aegyptiaca | Cucurbitaceae | APO14267.1 | 332 | 100.00 |
| 8 | Cucurbita | Cucurbita maxima | Cucurbitaceae | XP_023001288.1 | 332 | 92.47 |
| 9 | Cucurbita | Cucurbita pepo subsp. pepo | Cucurbitaceae | XP_023519941.1 | 333 | 96.73 |
| 10 | Cucurbita | Cucurbita argyrosperma subsp. sororia | Cucurbitaceae | KAG6584088.1 | 332 | 93.07 |
| 11 | Cucurbita | Cucurbita argyrosperma subsp. argyrosperma | Cucurbitaceae | KAG7019688.1 | 333 | 96.74 |
| 12 | Cucurbita | Cucurbita moschata | Cucurbitaceae | XP_022924014.1 | 339 | 91.15 |
| 13 | Cannabis | Cannabis sativa | Cannabaceae | XP_004145112.1 | 331 | 97.72 |
| 14 | Trema | Trema orientale | Cannabaceae | PON84027.1 | 333 | 93.49 |
| 15 | Parasponia | Parasponia andersonii | Cannabaceae | PON43911.1 | 333 | 93.16 |
| 16 | Cephalotus | Cephalotus follicularis | Cephalotaceae | GAV69709.1 | 331 | 92.16 |
| 17 | Juglans | Juglans macrocarpa x Juglans regia | Juglandaceae | XP_041028317.1 | 332 | 93.46 |
| 18 | Juglans | Juglans regia | Juglandaceae | XP_018808928.2 | 332 | 93.46 |
| 19 | Carya | Carya illinoinensis | Juglandaceae | XP_042945118.1 | 331 | 93.46 |
| 20 | Populus | Populus alba | Salicaceae | XP_034927795.1 | 331 | 92.51 |
| 21 | Populus | Populus tomentosa | Salicaceae | AKE81099.1 | 331 | 92.18 |
| 22 | Populus | Populus trichocarpa | Salicaceae | XP_002304909.1 | 331 | 92.51 |
| 23 | Hevea | Hevea brasiliensis | Euphorbiaceae | XP_021636083.1 | 331 | 92.18 |
| 24 | Manihot | Manihot esculenta | Euphorbiaceae | XP_021597652.1 | 331 | 93.16 |
| 25 | Jatropha | Jatropha curcas | Euphorbiaceae | XP_012091347.1 | 331 | 92.83 |
| 26 | Morella | Morella rubra | Myricaceae | KAB1200731.1 | 331 | 92.51 |
Protein sequence analysis
Multiple protein sequence alignments were conducted to identify regions of similarity between sequences that may reflect functional, structural, or evolutionary relationships. The query sequence and peroxidase from different plant sources were uploaded into the Molecular Evolutionary Genetics Analysis (MEGA 11) tool for the automatic and manual alignment of the protein sequences. The aligned protein sequences were saved in MEGA or FASTA format to build molecular models and study evolutionary relationships with plant peroxidases. A neighbour-joining phylogenetic tree was constructed using the Saitou and Nei method (Saitou and Nei 1987). Each node was tested using the bootstrap method by taking 1000 replicates.
Physiochemical analysis
The physiochemical of luffa peroxidase was analysed with Expasy PROTPARAM (Gasteiger et al. 2005). The in silico tool is available at https://web.expasy.org/protparam/. The query sequence was uploaded into the Protparam platform, and parameters such as the molecular weight, theoretical pI, amino acid composition, atomic composition, extinction coefficient, estimated half-life, instability index, aliphatic index, and grand average of hydropathicity (GRAVY) were computed. The extinction coefficient in waster was computed by following the equation given below.
where (for proteins in water measured at 280 nm): Ext(Tyr) = 1490, Ext(Trp) = 5500, Ext(Cystine) = 125.
The absorbance was calculated using the following formula:
The aliphatic index of a protein was calculated according to the following formula given by Ikai (1980) (Ikai 1980).
where x(Ala), x(Val), x(Ile), and x(Leu) are mole per cent (100 × mole fraction) of alanine, valine, isoleucine, and leucine. The coefficients a and b are the relative volume of the valine side chain (a = 2.9) and Leu/Ile side chains (b = 3.9) to the side chain of alanine.
The GRAVY value for a peptide or protein was calculated as the sum of hydropathy values of all the amino acids, divided by the number of residues in the sequence (Kyte and Doolittle 1982).
Structure prediction
Firstly, the secondary structure of LPrx was predicted using the Self-optimised prediction method of alignment (SOPMA) available at https://npsa-prabi.ibcp.fr/NPSA/npsa_sopma.html (Combet et al. 2000). The target protein sequence was uploaded into the Network protein sequence analysis (NPS@) server, and the frequency of the secondary structure (alpha helix, random coil, beta-turn, and extended strand) was automatically computed with default parameters and further analysed. The homology modelling of the tertiary structure of LPrx was carried out using the SWISS-MODEL available at https://swissmodel.expasy.org/interactive (Bienert et al. 2017). The target protein sequence was uploaded into the SWISS-MODEL server, and the best template matching the target sequence was selected to build the homology model. The structure assessment was carried out to determine the significance of the homology model, and it was validated by MolProbity, PROCHECK, ERRAT, ProSA, ProQ, and VARIFY 3D tools.
Function prediction
The query amino acid sequence was uploaded into I-TASSER sever, and the biological annotations of the LPrx were predicted by COFACTOR and COACH based on the I-TASSER structure prediction (Yang et al. 2015). COFACTOR deduces protein functions (ligand-binding sites, EC, and GO) using structure comparison and protein–protein networks. COACH is a meta-server approach that combines multiple function annotation results (on ligand binding sites) from the COFACTOR, TM-SITE, and S-SITE programs.
Enzyme-ligand interactions
Molecular docking of LPrx and organic substrates viz. guaiacol, m-cresol, p-cresol, catechol, quinol, pyrogallol, 4-nitrophenol, 2,4-dimethoxyphenol, aniline, and o-phenylenediamine were carried out to analyse the different types of interactions, active sites, and the key amino acid residues involved in the enzyme catalysis. The characteristics of ligands are listed in tabular form in Table 7. The ligands were retrieved from the PubChem database in the SDF format (https://pubchem.ncbi.nlm.nih.gov/). The receptor molecule is the predicted 3D structure of LPrx enzyme. The LPrx and the ligands were imported to PyRx autodock tool in pdb and sdf format to minimise their energy and convert into pdbqt format with OpenBabel. The ligands were docked into receptor molecules using AutoDock Vina tool. The binding sites of LPrx were defined with a rectangular grid box of 60.941 × 60.305 × 60.678 covering the entire grid points separated by 1 Å. The parameters size_x, size_y and size_z was set to 36, 48, and 58, and the exhaustiveness was set to 8. The different models of enzyme-ligand interaction were generated using the Windows 11 command prompt. The output models of enzyme-ligand interactions with high negative binding affinity were imported into the Discovery Visual Studio tool to analyse interactions between LPrx and ligands in 3D and 2D models. The interaction of heme b, and Ca2+ ion with different amino acid residues of LPrx was analysed in I-TASSER server.
Results and discussion
Protein sequence analysis
The process of protein sequencing involves determining the amino acid residues of a protein or peptide. Matrix-Assisted Laser Desorption/Ionisation—Time of Flight Mass Spectrophotometry (MALDI-TOF MS) is the most commonly used sophisticated method for identifying and sequencing proteins or peptides. The procedure involves excision of protein bands from a gel, proper washing, detaining of gel, in-gel reduction and alkylation of protein, in-gel digestion of protein with trypsin, followed by MALDI-TOF MS of the tryptic peptides, and database searching of the peptide mass fingerprinting (PMF) data (Webster and Oxley 2012). The m/z obtained in the mass spectrum were interpreted in the MASCOT server (https://www.matrixscience.com/server.html) to determine the molecular weight and amino acid residues of LPrx. A total of 332 amino acid residues identified are given below.
1 MGSRTLFFFI LLSFLASASF RSASAQDEED TGLVMNFYKD TCPQAEDIIK
51 EQVRLLYKRH KNTAFSWLRN IFHDCAVQSC DASLLLDSTR RTLSEKETDR
101 SFGLRNFRYI ETIKEAVERE CPGVVSCADI LVLSARDGIV SLGGPYIPLK
151 TGRRDGRRSR AEVVEEYLPD HNESMSVVLE RFAAMGIDTP GVVALLGAHS
201 VGRTHCVKLV HRLYPEVDPV LNPGHVEHML YKCPDEIPDP KAVQYVRNDR
251 GTPMILDNNY YRNILDNKGL LIVDHQLATD KRTKPYVKKM AKKQDYFFKE
301 FSRAITILSE NNPLTGTKGE IRKQCNVANK LH
Physiochemical analysis
The physiochemical parameters of LPrx were analysed with the translator tool of ExPASy. The analysis of protein sequence using the ProtParam tool revealed that a protein had a molecular weight of 37.730 kDa. The theoretical pI value was obtained at 8.52, suggesting that the protein was basic. The amino acid composition of the protein is given in Table 1. Leu (L) was the dominant residue with 9.9% occupancy in the amino acid sequence, and Trp (W) was found to be the least with 0.3%. There was no presence of Pyl (O) and Sec (U) observed in the sequence. The composition of atoms is given in Table S1. The predicted formula was C1669H2657N475O492S15. The total number of negatively charged residues (Asp + Glu) and positively charged residues (Arg + Lys) was 43 and 47, respectively.
Table 1.
Amino acid composition of luffa peroxidase
| Sl. No | Amino acid | Total | Percentage (%) |
|---|---|---|---|
| 1 | Ala (A) | 21 | 6.3 |
| 2 | Arg (R) | 26 | 7.8 |
| 3 | Asn (N) | 15 | 4.5 |
| 3 | Asp (D) | 22 | 6.6 |
| 4 | Cys (C) | 8 | 2.4 |
| 5 | Gln (Q) | 8 | 2.4 |
| 6 | Glu (E) | 21 | 6.3 |
| 7 | Gly (G) | 18 | 5.4 |
| 8 | His (H) | 10 | 3.0 |
| 9 | Ile (I) | 17 | 5.1 |
| 10 | Leu (L) | 33 | 9.9 |
| 11 | Lys (K) | 21 | 6.3 |
| 12 | Met (M) | 7 | 2.1 |
| 13 | Phe (F) | 14 | 4.2 |
| 14 | Pro (P) | 15 | 4.5 |
| 15 | Ser (S) | 21 | 6.3 |
| 16 | Thr (T) | 17 | 5.1 |
| 17 | Trp (W) | 1 | 0.3 |
| 18 | Tyr (Y) | 12 | 3.6 |
| 19 | Val (V) | 25 | 7.5 |
| 20 | Pyl (O) | 0 | 0.0 |
| 21 | Sec (U) | 0 | 0.0 |
The absorbance of 0.1% (1 g/L) at λmax = 280 nm was 0.633 with a molar extinction coefficient of 23,880 M−1 cm−1, assuming all pairs of Cys residues formed cystines while assuming all Cys residues were reduced, the absorbance was 0.620 with the extinction coefficient of 23,880 M−1 cm−1. The presence of tyrosine, tryptophan, and cystine in the amino acid sequences is responsible for light absorption (> 260 nm). The presence of 0.3%, 3.6%, and 2.4% of Trp, Typ, and Cys residues was detected, respectively. This protein, therefore, can be analysed by spectrophotometry techniques. The instability index (II) was computed and found that the protein was slightly unstable (II > 46.17). The aliphatic index (AI) is defined as the relative volume of a protein occupied by the aliphatic side chain, which is regarded as the positive factor for increasing the thermal stability of globular proteins (Ikai 1980). The higher the value higher will be the stability of the enzyme. The aliphatic index was 86.90. The result indicated that LPrx was thermally stable over a range of temperatures. The GRAVY was found to be – 0.365. The negative value of GRAVY inferred that the protein was hydrophilic and could interact better with water.
Homology modelling of structure
The secondary structure of LPrx was predicted by SOPMA using default parameters like the number of conformational states: 4, similarity threshold: 8; and window width: 17. The predicted structure revealed that the random coil dominated the secondary structure, followed by an alpha helix, extended strain, and beta-turn. The characteristic features of the secondary structures are presented in Table 2. Fig. 2(a) shows the amino acid sequence of the secondary structure, and Fig. 2 (b) is the graphical representation of the composition of secondary structures of protein.
Table 2.
Elements of the secondary structure of luffa peroxidase
| Sl. No | Secondary structure | Number of amino acid residues | Percentage (%) |
|---|---|---|---|
| 1 | Alpha helix (Hh) | 123 | 37.05 |
| 2 | 310 helix (Gg) | 0 | 0.00 |
| 3 | Pi helix (Ii) | 0 | 0.00 |
| 4 | Beta bridge (Bb) | 0 | 0.00 |
| 5 | Extended strand (Ee) | 49 | 14.76 |
| 6 | Beta turn (Tt) | 26 | 7.83 |
| 7 | Bend region (Ss) | 0 | 0.00 |
| 8 | Random coil (Cc) | 134 | 40.36 |
| 9 | Ambiguous states | 0 | 0.00 |
| 10 | Other states | 0 | 0.00 |
Fig. 2.

(a) Amino acid sequence of the secondary structure of LP. (Hh) represents alpha helix, (Ee) extended strand, (Tt) beta turn, and (Cc) random coil. (b) graphical representation of the amino acid sequence. The red line represents the extended strand, the blue line is the alpha helix, the green line is the beta turn, and the violet line is the random coil
The tertiary structure was built using a Swiss model with royal palm tree peroxidase as a template (5AOG). The Swiss model is a fully automated protein structure homology-modelling server, accessible via the Expasy web server or the program DeepView (Swiss Pdb-Viewer). The best template for the homology model was selected based on the Global model quality estimate (GMQE), QMEANDisCo Global, sequence identity percentage, QMEAN Z-scores, and coverage. The sequence identity of the query sequence to that of the template was 35.57%. The chosen template met the criteria for the homology modelling with a GMQE value of 0.71, QMEANDisCo Global 0.73 ± 0.05, and QMEAN Z-score -2.19. The QMEAN Z-scores, comparison with a non-redundant set of PDB structures, local quality estimation, and residual quality of are presented in Fig. 3 (A), (B), (C), and (D), respectively.
Fig. 3.

Quality estimate: (A) QMEAN Z-scores, (B) Comparison with a non-redundant set of PDB structures, (C) Local quality estimation of luffa peroxidase, and (D) Residual quality. The figures were generated on the Swiss server
The predicted 3D structure—(A) Cartoon and (B) Molecular Surface is shown in Fig. 4. The Swiss model uses the MolProbity tool as a structure validation web service for proteins and nucleic acids based on international and local information. It adds and optimises H atoms and calculates global and regional validation for all-atom contacts (steric clashes, H-bonds & Van der Waals forces), covalent geometry, and conformation. Fig. 4(C) shows the Ramachandran plot, where 95.27% of amino acid residues lay in the most favoured regions and 0.68% in outlier regions (A106 ASN, A79 SER). Rotamer outliers—1.14% (A200 SER, A131 LEU, A106 ASN), C-beta deviation—1 (A257 ASP), ban bonds—0/2432, bad angles 27/3290 ((A144 GLY-A145 PRO), A62 ASN, (A312 ASN-A313 PRO), (A62 ASN-A63 THR), (A189 THR-A190 PRO), (A237 ILE-A238 PRO), A106 ASN, (A284 LYS-A285 PRO), A107 PHE, A205 HIS, A228 HIS, (A101 SER-A102 PHE), A60 HIS, A100 ARG, A225 HIS, A64 ALA, A211 HIS, A275 HIS, A40 ASP, (A214 TYR-A215 PRO)) and cis non-proline was 2/282 (A101 SER-A102 PHE), A215 PRO-A216 GLU). The MolProbity score of the predicted model was 1.92, with a clash score of 8.82. Clash score is an approximation of the overall severity of the clashes in the structure. Clashes are steric overlaps of 0.4 A or greater between non-bonded atoms. The MolProbity score is the combination of the clash score, rotamer, and Ramachandran evaluations into single score, normalized to be on the same as X-ray crystallisation resolution. A lower MolProbity score and a class score indicate good quality of the predicted model.
Fig. 4.

Predicted structure of luffa peroxidase: (A) Cartoon, and (B) Molecular Surface, and (C) Ramachandran plot of the predicted protein structure obtained from MolProbity server
Validation of protein structure
PROCHECK, ERRAT, ProSA, ProQ, and VERIFY 3D tools are commonly used to validate the predicted protein structure. The validation scores obtained from these tools are presented in Table 3. The PROCHECK was used to analyse the stereochemical quality of protein structures residue-by-residue. The PROCHECK generates a Ramachandran plot based on an analysis of 118 structures of resolution of at least 2.0 Angstroms and R-factor no greater than 20%. The PROCHECK validation showed a warning sign with 90.9% of the amino acid residues in most favoured regions, 7.9% in additional allowed, 0.8% generously allowed, and 0.4% in disallowed regions. A good quality model has over 90% in the most favoured and less than 1% in the disallowed regions (Laskowski et al. 1993).
Table 3.
Validation scores obtained from efficient protein structure validation tools
| Sl. No | Tools | Parameters | Value |
|---|---|---|---|
| 1 | PROCHECK | Most favoured regions | 90.9% |
| Additionally allowed regions | 7.9% | ||
| Generously allowed regions | 0.8% | ||
| Disallowed regions | 0.4% | ||
| 2 | ERRAT | Overall quality factor | 88.97 |
| 3 | ProSA | Z-score | – 5.26 |
| 4 | ProQ | LG score | 7.348 |
| 5 | VERIRY 3D | Verify score | 86.24 |
ERRAT is a program for verifying protein structures determined by crystallography. Errors are plotted as a function of the position of a sliding 9-residue window. The error function is based on the statistics of non-bonded atom–atom interactions in the reported structure (compared to a database of reliable high-resolution structures). The overall quality factor obtained for the current structure was 88.97%. The general acceptance range is > 50% for a good quality model.
ProSA is an interactive web tool for refining and validating protein structures and predicting and modelling structures (Wiederstein and Sippl 2007). The model with Z-score close to or greater than 0 is considered a good protein model. The Z-score is defined as the energy separation between the native fold and the average of an ensemble of misfolds in the units of the standard deviation of the ensemble (Zhang and Skolnick 1998). The Z-score of the predicted model was -5.26.
ProQ is a neural network-based predictor that predicts the quality of proteins based on several structural features (Wallner and Elofsson 2003). It is optimised to find correct models compared to other methods geared toward finding native structures. It provides LGscore and MaxSub of the predicted model. LGscore > 1.5 are a fairly good model, LGscore > 2.5 is a very good model, and LGscore > 4 is an extremely good model. MaxSub > 0.1 fairly good model, MaxSub > 0.5 very good model, and MaxSub > 0.8 extremely good model. The predicted LGscore of the predicted model was 7.348, and the predicted Maxsub of -0.654.
VERIFY 3D determines the compatibility of an atomic model (3D) with its amino acid sequence (1D) by assigning a structural class based on its location and environment (alpha, beta, loop, polar, nonpolar, etc.) and comparing the results to good structures (Eisenberg et al. 1997).VERIFY 3D: 86.24% of the residues have averaged 3D-1D score > = 0.2. At least 80% of the amino acids have scored > = 0.2 in the 3D/1D profile. Hence, based on the Ramachandran plot, overall quality factor score, z-score, LGscore, and Verify score, the 3D homology model of LPrx obtained was fairly good.
Phylogenetic analysis
The evolutionary relationship of LPrx with other class III peroxidases was studied by constructing a neighbour-joining phylogenetic tree. The list of peroxidases from different plant sources used to construct the phylogenetic tree is presented in Table 4. A total of eleven sequences belonged to the Cucurbitaceae family, three each belonged to Cannabaceae, Juglandaceae, Salicaceae, and Euphorbiaceae, and one from Cephalotaceae and Myricaceae. The number of amino acid residues of all plant species was > 300.
Luffa sp., Cucumis sp., Benincasa sp., Momordica sp., and Cucurbita sp. all belong to a Cucurbitaceae family, and they should possess homologous proteins as reflected by the pair identity percentage in Table 4. Proteins with high sequence identity and similar structures tend to possess functional similarity and evolutionary relationships (Hark Gan et al. 2002). LPrx was observed to be very identical to that of peroxidases from Luffa aegyptiaca, Cucumis sativus, Cucumis melo, Cucumis melo var. makuwa, Benincasa hispida, and Momordica charanttia with a pair identity > 96%. They all belong to the Cucurbitaceae family. The phylogenesis showed a common ancestor of all peroxidases with slight divergence among the Cucurbitaceae, Cannabaceae, Juglandaceae, Salicaceae, Euphorbiaceae, and Myricaceae family. Figure 5 shows the neighbour-joining livelihood phylogenetic tree of plant peroxidases. The co-ancestor for peroxidase from Cucurbitaceae and Cannabaceae families was found to be the same from the root. Similarly, the co-ancestor was the same for Juglandaceae, Salicaceae, Euphorbiaceae, and Myricaceae. From phylogenetic tree analysis, it is now evident that Class III peroxidases share a common ancestor.
Fig. 5.

Neighbor-joining livelihood phylogenetic tree of plant peroxidases. The amino acid sequences were aligned, and the tree was constructed in MEGA 11 tool using the bootstrap method of 1000 replicates
Functions prediction
Gene Ontology (GO) is a set of concepts and a framework for explaining the functions of genes in all organisms. GO offers a detailed definition of protein function and is one of the significant bioinformatics sources. There are three ontologies: Molecular functions, biological processes, and cellular components. It was created to assist in the computational depiction of biological systems. A GO annotation links a specific gene product and a GO concept, forming a statement about the gene's function. The function of LPrx was predicted by COFACTOR and COACH based on the I-TASSER structure prediction.
After the structure assembly simulation, I-TASSER uses the TM-align structural alignment program to match the first I-TASSER model to all structures in the PDB library. COFACTOR deduced protein functions (ligand-binding sites, EC, and GO) using structure comparison and protein–protein networks. COACH is a meta-server approach that combines multiple function annotation results (on ligand-binding sites) from the COFACTOR, TM-SITE, and S-SITE programs. COACH has been extensively trained to derive biological functions from multi-source of sequence and structure features, which has, on average, higher accuracy than the function annotations derived only from the global structure comparison. Table 5 shows the result of the top 10 homologous GO templates in PDB generated by using I-TASSER server that have the closest structural similarity, i.e., the highest TM-score, to the predicted I-TASSER model. Table 6 shows a consensus GO term amongst the top-scoring templates. The GO-Score associated with each prediction is defined as the average weight of the GO term, where the weights are assigned based on the CscoreGO of the template. Due to the structural similarity, these proteins often function similarly to the target.
Table 5.
Top 10 homologous GO templates in PDB generated by using I-TASSER server
| Rank | 1CscoreGO | 2TM-score | 3RMSDa | 4IDENa | 5Cov. | PDB Hit | Associated GO Terms |
|---|---|---|---|---|---|---|---|
| 1 | 0.48 | 0.8621 | 1.11 | 0.36 | 0.88 | 1schA | GO:0042744, GO:0055114, GO:0004601, GO:0046872, GO:0005576, GO:0016491, GO:0006979, GO:0,020,037 |
| 2 | 0.47 | 0.8603 | 1.45 | 0.35 | 0.89 | 1fhfA | GO:0004601, GO:0006979, GO:0020037, GO:0055114 |
| 3 | 0.46 | 0.8466 | 1.35 | 0.37 | 0.87 | 1qgjA | GO:0005634, GO:0042744, GO:0016491, GO:0046872, GO:0005576, GO:0055114, GO:0005737, GO:0004601, GO:0006979, GO:0020037 |
| 4 | 0.46 | 0.8723 | 1.25 | 0.36 | 0.90 | 1pa2A | GO:0004601, GO:0005576, GO:0042744, GO:0055114, GO:0016491, GO:0046872, GO:0006979, GO:0020037 |
| 5 | 0.44 | 0.8680 | 1.40 | 0.34 | 0.90 | 1gx2A | GO:0004601, GO:0016491, GO:0042744, GO:0055114, GO:0046872, GO:0005773, GO:0005576, GO:0006979, GO:0020037 |
| 6 | 0.44 | 0.8946 | 0.38 | 0.36 | 0.90 | 3hdlA | GO:0004601, GO:0006979, GO:0020037, GO:0055114 |
| 7 | 0.44 | 0.8710 | 1.50 | 0.34 | 0.91 | 1bgpA | GO:0046872, GO:0055114, GO:0016491, GO:0004601, GO:0006979, GO:0020037 |
| 8 | 0.43 | 0.6619 | 2.08 | 0.25 | 0.71 | 1oafA | GO:0055114, GO:0005737, GO:0042744, GO:0016688, GO:0046872, GO:0004601 GO:0,016,491 GO:0,006,950 GO:0,006,979 GO:0,020,037 |
| 9 | 0.40 | 0.6526 | 2.70 | 0.22 | 0.72 | 1cyfA | GO:0004601, GO:0006979, GO:0020037, GO:0055114 |
| 10 | 0.40 | 0.6516 | 2.31 | 0.26 | 0.70 | 3riwB | GO:0004601, GO:0006979, GO:0020037, GO:0055114 |
1. CscoreGO is a combined measure for evaluating the global and local similarity between query and template protein. Its range is [0–1], and higher values indicate more confident predictions. 2. TM-score measures global structural similarity between query and template protein. 3. RMSDa is the RMSD between residues that are structurally aligned by TM-align. 4. IDENa is the percentage sequence identity in the structurally aligned region. 5. Cov. represents the coverage of global structural alignment and is equal to the number of structurally aligned residues divided by the length of the query protein
Table 6.
Consensus prediction of GO terms
| 1 | Molecular Function GO-Score |
GO:0020037 0.95 |
GO:0004601 0.95 |
GO:0055114 0.95 |
|---|---|---|---|---|
| 2 |
Biological Process GO-Score |
GO:0042744 0.91 |
– | – |
| 3 |
Cellular Component GO-Score |
GO:0005576 0.91 |
GO:0005634 0.46 |
GO:0005634 0.44 |
In Table 6, the GO terms GO:0020037, GO:0004601, and GO:0055114 are associated with molecular functions. The GO:0020037 defined binding to heme, a compound composed of iron complexed in a porphyrin (tetrapyrrole) ring. The GO:0004601 defined catalysis of the reaction: a donor + a peroxide = an oxidised donor + 2 H2O. The GO:0055114 defined a metabolic process mediated by peroxidases that remove or add one or more electrons to or from a substance, with or without the concomitant removal or addition of a proton or protons. The GO:0042744 is associated with the enzyme's biological function—the chemical reactions and pathways resulting in hydrogen peroxide (H2O2) breakdown. The GO:0005576, GO:0005634, and GO:0005634 are associated with cellular components. It defined the space external to the outermost structure of a cell. It referred to space outside the plasma membrane for cells without external protective or encapsulating structures. The ancestor charts for GO:0004601, GO:0020037, and GO:0005576 are given in Fig. 6, Fig. 7, and Fig. 8.
Fig. 6.

Ancestor chart for GO:0004601. The black lines represent 'is a', and the blue lines represent 'part of ' (http://amigo.geneontology.org/amigo/term/GO:0004601)
Fig. 7.

Ancestor chart for GO:0020037. The black lines represent 'is a', and the blue lines represent 'part of ' (http://amigo.geneontology.org/amigo/term/GO:0020037)
Fig. 8.
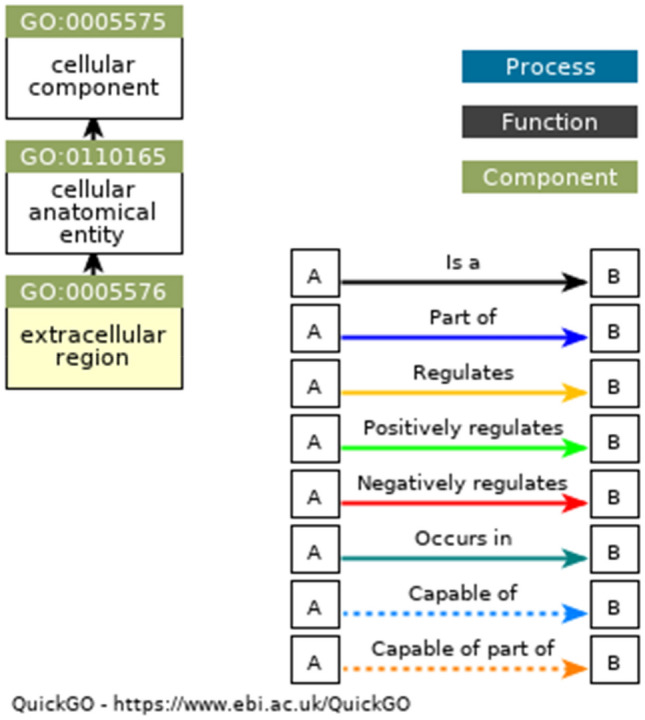
Ancestor chart for GO:0005576. The black lines represent 'is a', and the blue lines represent 'part of ' (http://amigo.geneontology.org/amigo/term/GO:0005576)
Enzyme-ligand interactions
As depicted in Fig. 6, peroxidases are oxidoreductase enzymes, and their molecular function is to oxidise or reduce substrates within the reaction system. They play a key role in the biotransformation of phenols, aromatic amines, and a wide spectrum of inorganic and organic substrates in the presence of H2O2. The interaction of phenolic compounds and their derivatives such as guaiacol, m-cresol, p-cresol, anisole, catechol, and pyrogallol with peroxidase has been determined experimentally at room temperature and found that the enzyme effectively oxidised them into their respective quinones (Yadav et al. 2017). The catalytic cycle of peroxidases is a 3 step oxidation–reduction process. In the first step, the native enzyme is oxidised by H2O2 to an active intermediate form known as compound I, and H2O2 is reduced to H2O. During the catalytic reaction, H2O2 is coordinated to the ferric heme centre peroxidase, resulting in peroxo complex. The compound undergoes O–O bond heterolytic cleavage to form oxyferryl porphyrin π cation radical. Compound I oxidises substrate RH to a free radical R* and converts it to compound III. The enzyme returns to its native state by oxidising another RH to R* as shown in Fig. 9. Finally, R* produced in the reaction system reacts non-enzymatically to produce polyaromatic or polymerised products.
Fig. 9.

General catalytic mechanism of peroxidases in the presence of electron mediator H2O2 (Flohé et al. 2022)
Bioinformatics is now an essential tool in the study of enzyme catalysis. The study of enzyme-ligand interactions helps us to deeply interpret the relevant binding events in the enzyme-mediated oxidation or reduction of organic substances at a molecular level. Besides, it provides a clear picture of the molecular and biological function of peroxidases annotated in the gene ontology database. In this section, we applied the molecular docking technique to investigate the possible interactions with the ligands and LPrx in enzyme catalysis. All ligands and LPrx docking were performed with AutoDock Vina, which uses a Monte Carlo simulation with a rapid energy evaluation using grid-based molecular affinity potentials (Trott and Olson 2010). Although experimental techniques can investigate basic thermodynamics parameters for protein–ligand interactions, the procedures for determining binding affinity are difficult, time-consuming, and expensive. The computation prediction of binding affinity is obtained using free energy calculations that take into account all thermodynamically relevant phenomena, including protein dynamics/flexibility, explicit solvent consideration, and the difference between the interactions between protein-ligands in complexes and their interactions with water and counterions in their unbound forms (Du et al. 2016).
Different types of protein–ligand interactions with ligand molecules are presented in Table 7. Carbon-hydrogen bond, conventional hydrogen bond, alkyl, pi-donor hydrogen bond, pi-pi stacking, pi-alkyl, pi-sigma, pi-cation, pi-anion, and pi-sulfur interaction were observed with ligands and amino acid residues of LPrx. A carbon-hydrogen bond was observed among Arg69 and Lys39 with guaiacol and catechol. Conventional hydrogen bond type was seen among Met 35, Cys42, Leu68, Arg69, Asp99, Arg100, Phe102, Leu149, Arg203, His205, and Asp239. Phe72 was involved in pi-pi stacked interaction with guaiacol, m-cresol, p-cresol, aniline, and o-phenylenediamine. Pi-alkyl was detected with all ligands. The residues involved in pi-alkyl type were Ala45, His73, Leu195, Ala198, His199, and Lys208. Alkyl interactions were seen among Arg 69, Leu196, and Leu271 with guaiacol, m-cresol, p-cresol, and o-phenylenediamine. Pi-cation with Arg69 and catechol, pyrogallol, and o-phenylenediamine, while, Glu46 and Asp239 were involved in pi-anion interaction with quinol and pyrogallol. Pi-sigma was seen with p-cresol and Phe72 residue, and pi-sulfur with Met 35 and quinol. The unfavourable donor-donor interaction was seen between Arg69 and 2,4-dimethoxyphenol. The binding affinity of each ligand obtained from molecular docking in AutoDock Vina is presented in Table 7. All ligands showed binding affinity > -5.0 kcal/mol, which is a good binding affinity for enzyme ligand interactions. The more negative energy exhibits the more favourable binding (Nokthai et al. 2010). For phenolic ligands, the highest binding affinity of – 6.0 kcal/mol was found with gallic acid, and catechol showed the lowest binding affinity of -5.3 kcal/mol. Aniline and o-pheylenediamine showed the same value of -5.2 kcal/mol. The results indicated that LPrx has a high affinity for phenolic and aromatic amine ligands.
Plant peroxidases contain iron protoporphyrin IX as a prosthetic group and Ca2+ metal ion. The heme b interacting amino acid residues that were reported in HRP were Asp, Gly, Ile, Ser, Thr, and Val while Asp, Ser, and Thr were found coordinated to the two Ca2+ (Veitch 2004). The interaction of the important component of LPrx, heme b, and Ca2 + ion with different amino acid residues were analysed in I-TASSER server. The homology model of heme b and Ca2+ ligands binding sites were deduced by COFACTOR based on the I-TASSER server structure predictions. The C-score value closer to 1 is considered a good model. The heme b and Ca2 + binding C-score were 0.77 and 0.05, respectively. Their interactions with amino acid residues are depicted in Fig. 10. Here we have observed that residues 62, 65, 66, 68, 69, 72, 169, 170, 171, 178, 182, 195, 196, 198, 199, 201, 202, 203, 204, 205, 208, 248, 271, 273, 301, and 305 of LPrx were found interacting with the heme b ligand and 200, 249, 252, 255, and 257 with Ca2+ ion. The results obtained were quit similar to those of HRP. Ala, Leu and Phe were found additional heme b interacting key amino acid residues to those reported in HRP. While in the case of two Ca2+, Ala, Gly, Ile, and Pro were found additional interacting residues.
Fig. 10.

Homology model of (A) heme binding and (B) Ca2+ binding sites deduced by COFACTOR on I-TASSER server
The molecular docking revealed that the key amino acid residues of LPrx actively involved in interactions with ligands shown in Table 8 are Ala, Arg, Asp, Cys, Glu, Gly, His, Leu, Lys, Met, and Phe. The interacting residues of LPrx were similar to that of HRP, which is the most widely studied and well characterised peroxidase. Veitch reported Ala, Arg, Asp, Asn, Gly, His, Phe and Pro interacting residues of HRP with organic substrates during enzyme catalysis (Veitch 2004). Similar experiments have been also reported using molecular docking tools like AutoDock Vina and CDOCKER (Acebes et al. 2017; Singh et al. 2021a, 2022a). Pandey et al. reported Ala, Arg, Asn, Glu, Gly, His, Ile, Lue, Phe, Pro, Thr, and Val were the key interacting amino acids of papaya peroxidase with guaiacol, o-dianicidine, veratryl alcohol, ascorbate, heme, cysteine, DTT, 2,3-butanedione, and 1,2-cyclohexanedione (Pandey et al. 2013). Based on in silico analysis, Notkhai et al. have also reported amino acid residues of grape peroxidase namely Arg, Ala, Asn, Leu, Pro, and Ser were involved in interactions with common organic substrates such as guaiacol, pyrogallol, gallic acid, p-hydroxybenzoic acid, and 4-methylcatechol (Nokthai et al. 2010). Thus, the data observed in our investigations and literature revealed that the key interacting amino acid residues with organic substrates are conserved among the class III peroxidases.
Table 8.
Enzyme-ligands interactions


Limitations and future perspective
The present study involved protein sequencing of LPrx, protein profiling, homology modelling, analysis of functionality and functional domain identification, and protein–ligand interaction. The novel data presented in this study will expand the proteomics studies and research and development of new bioinformatics techniques. This study adopted a theoretical and computational approach. The physiochemical properties and homology modelling of the protein structure of LPrx presented in the current communication are purely based on approximated scoring functions obtained from bioinformatics tools such as ProtParam, SOPMA, Swiss Model, AutoDock Vina, and I-TASSER. Therefore, the results presented here may deviate from the experimental values. The study of enzyme-ligand interactions was restricted to simple phenolic compounds and aromatic amine. LPrx catalyses the oxidation of inorganic and organic compounds (Basumatary et al. 2020). However, the interactions of complex inorganic and organic compounds with LPrx are yet to be explored.
Plant-based peroxidases have gained attention due to their robust catalytic activity, high specificity, ease of storing, cost-effectiveness, and efficiency in the bioconversion of inorganic and organic compounds over conventional methods. They have been used in the degradation of hazardous pollutants such as phenols, amines, dyes, pesticides, and thousands of recalcitrant inorganic and organic pollutants. The present study characterised the structural and functional aspects and will establish LPrx as a potent biocatalyst for the remediation of the environment. The study of enzyme-ligand interaction will facilitate the development of a new synthesis method for organic compounds. The finding in this study will pave the way for the application of peroxidases in genetic engineerings, such as genetic mutation for synthesizing synthetic proteins, and biotechnological applications, like the development of biosensors for detecting recalcitrant organic pollutants. The study will also deliver the scope of peroxidases in the discovery and drug design as the enzyme in pharmaceutical industries. In addition to providing insight into the molecular and functional aspects of peroxidases, the phylogenetic output presented here will also be useful for planning experiments aimed at the evolutionary relationship of different peroxidases belonging to Class I, Class II, and Class III peroxidases.
Conclusion
This study provided vital information about the characteristics and functionality of peroxidase from Luffa acutangula. The validation of homology models of luffa peroxidase was well within a reliable model. The phylogenetic analysis revealed that the peroxidases from plant sources showed divergence from the common ancestor of the roots. The biological function prediction showed that the peroxidases are involved in the reactive oxygen species scavenging activity. The two main predicted molecular functions of luffa peroxidase were found to be—(i) the oxidation or reduction of organic substrates in the presence of H2O2. and (ii) heme binding. The molecular docking revealed that the enzyme had a high affinity toward phenolic substrates and aromatic amines. The LPrx, therefore, can act as a suitable biocatalyst substitute for the biotransformation of organic substrates. This research will be influential in bioinformatics and biotechnology and will also have significance in the biotransformation of phenols and other organic compounds.
Supplementary Information
Below is the link to the electronic supplementary material.
Acknowledgements
The authors thank the Department of Chemistry, North Eastern Regional Institute of Science and Technology, Nirjuli, Arunachal Pradesh, India, for providing adequate lab facilities and the Sandor Speciality Diagnostics Pvt. Ltd. for the MALDI-TOF MS data. The authors also thank the Ministry of Tribal Affairs, New Delhi, India, for providing fellowship to Dencil Basumatary under the “National Fellowship and Scholarship for Higher Education for ST Students” scheme.
Author contributions
DB has performed all experimental and software analyses and written the manuscript. SS has investigated and edited the manuscript. HSY and MY supervised and reviewed the manuscript. All authors reviewed and approved the final manuscript.
Data availability
All data generated or analysed during this study are available within the article.
Declarations
Conflict of interest
The authors declare no conflict of interest in any materials discussed in this article.
Consent for publication
This article does not contain any studies with human or animal subjects.
References
- Acebes S, Ruiz-Dueñas FJ, Toubes M, et al. Mapping the long-range electron transfer route in ligninolytic peroxidases. J Phys Chem B. 2017;121:3946–3954. doi: 10.1021/acs.jpcb.7b00835. [DOI] [PubMed] [Google Scholar]
- Baker MR, Zhao H, Sakharov IY, Li QX. Amino acid sequence of anionic peroxidase from the windmill palm tree Trachycarpus fortunei. J Agric Food Chem. 2014;62:11941–11948. doi: 10.1021/jf504511h. [DOI] [PMC free article] [PubMed] [Google Scholar]
- Basumatary D, Yadav M, Nath P, Yadav HS. Catalytic biotransformations and inhibition study of peroxidase from Luffa aegyptiaca. Curr Organocatalysis. 2020 doi: 10.2174/2213337207666200211095038. [DOI] [Google Scholar]
- Berglund GI, Carlsson GH, Smith AT, et al. The catalytic pathway of horseradish peroxidase at high resolution. Nature. 2002;417:463–468. doi: 10.1038/417463a. [DOI] [PubMed] [Google Scholar]
- Bienert S, Waterhouse A, De Beer TAP, et al. The SWISS-MODEL Repository—new features and functionality. Nucleic Acids Res. 2017;45:D313–D319. doi: 10.1093/nar/gkw1132. [DOI] [PMC free article] [PubMed] [Google Scholar]
- Cai F, Zhu Q, Zhao K, et al. Multiple signal amplified electrochemiluminescent immunoassay for Hg2+ using graphene-coupled quantum dots and gold nanoparticles-labeled horseradish peroxidase. Environ Sci Technol. 2015;49:5013–5020. doi: 10.1021/acs.est.5b00690. [DOI] [PubMed] [Google Scholar]
- Combet C, Blanchet C, Geourjon C, Deleage G. NPS@: network protein sequence analysis. Trends Biochem Sci. 2000;25:147–150. doi: 10.1016/S0968-0004(99)01540-6. [DOI] [PubMed] [Google Scholar]
- Du X, Li Y, Xia Y-L, et al. Insights into protein–ligand interactions: mechanisms, models, and methods. Int J Mol Sci. 2016;17:144. doi: 10.3390/ijms17020144. [DOI] [PMC free article] [PubMed] [Google Scholar]
- Eisenberg D, Lüthy R, Bowie JU (1997) VERIFY3D: Assessment of protein models with three-dimensional profiles. Methods Enzymol 277:396–404. 10.1016/s0076-6879(97)77022-8 [DOI] [PubMed]
- Flohé L, Toppo S, Orian L. The glutathione peroxidase family: Discoveries and mechanism. Free Radic Biol Med. 2022;187:113–122. doi: 10.1016/j.freeradbiomed.2022.05.003. [DOI] [PubMed] [Google Scholar]
- Gasteiger E, Hoogland C, Gattiker A, et al. Protein identification and analysis tools on the ExPASy server. In: Walker John M, et al., editors. proteomics Protoc Handb. Totowa, NJ: Humana Press; 2005. pp. 571–607. [Google Scholar]
- Hark Gan H, Perlow RA, Roy S, et al. Analysis of protein sequence/structure similarity relationships. Biophys J. 2002;83:2781–2791. doi: 10.1016/S0006-3495(02)75287-9. [DOI] [PMC free article] [PubMed] [Google Scholar]
- Herrero J, Fernández-Pérez F, Yebra T, et al. Bioinformatic and functional characterization of the basic peroxidase 72 from Arabidopsis thaliana involved in lignin biosynthesis. Planta. 2013;237:1599–1612. doi: 10.1007/s00425-013-1865-5. [DOI] [PubMed] [Google Scholar]
- Ikai A. Thermostability and aliphatic index of globular proteins. J Biochem. 1980;88:1895–1898. [PubMed] [Google Scholar]
- Kim SJ, Lee JA, Joo JC, et al. The development of a thermostable CiP (Coprinus cinereus peroxidase) through in silico design. Biotechnol Prog. 2010;26:1038–1046. doi: 10.1002/btpr.408. [DOI] [PubMed] [Google Scholar]
- Kumar S, Bhardwaj VK, Singh R, et al. Identification of acridinedione scaffolds as potential inhibitor of DENV-2 C protein: An in silico strategy to combat dengue. J Cell Biochem. 2022;123(5):935–946. doi: 10.1002/jcb.30237. [DOI] [PubMed] [Google Scholar]
- Kumar S, Bhardwaj VK, Singh R, Purohit R. Explicit-solvent molecular dynamics simulations revealed conformational regain and aggregation inhibition of I113T SOD1 by Himalayan bioactive molecules. J Mol Liq. 2021;339:116798. doi: 10.1016/j.molliq.2021.116798. [DOI] [Google Scholar]
- Kyte J, Doolittle RF. A simple method for displaying the hydropathic character of a protein. J Mol Biol. 1982;157:105–132. doi: 10.1016/0022-2836(82)90515-0. [DOI] [PubMed] [Google Scholar]
- Laskowski RA, MacArthur MW, Moss DS, Thornton JM. PROCHECK: a program to check the stereochemical quality of protein structures. J Appl Crystallogr. 1993;26:283–291. doi: 10.1107/S0021889892009944. [DOI] [Google Scholar]
- Morsi R, Bilal M, Iqbal HMN, Ashraf SS. Laccases and peroxidases: The smart, greener and futuristic biocatalytic tools to mitigate recalcitrant emerging pollutants. Sci Total Environ. 2020;714:136572. doi: 10.1016/J.SCITOTENV.2020.136572. [DOI] [PubMed] [Google Scholar]
- Moyo M. Horseradish peroxidase biosensor to detect zinc ions in aqueous solutions. Open J Appl Biosens. 2014;3(1):1–7. doi: 10.4236/ojab.2014.31001. [DOI] [Google Scholar]
- Moyo M, Okonkwo JO. Horseradish peroxidase biosensor based on maize tassel–MWCNTs composite for cadmium detection. Sens Actuators B Chem. 2014;193:515–521. doi: 10.1016/j.snb.2013.11.086. [DOI] [Google Scholar]
- Nokthai P, Lee VS, Shank L. Molecular modeling of peroxidase and polyphenol oxidase: substrate specificity and active site comparison. Int J Mol Sci. 2010;11:3266–3276. doi: 10.3390/ijms11093266. [DOI] [PMC free article] [PubMed] [Google Scholar]
- Nomngongo PN, Ngila JC, Nyamori VO, et al. Determination of selected heavy metals using amperometric horseradish peroxidase (HRP) inhibition biosensor. Anal Lett. 2011;44:2031–2046. doi: 10.1080/00032719.2010.539738. [DOI] [Google Scholar]
- Pandey VP, Awasthi M, Singh S, et al. A comprehensive review on function and application of plant peroxidases. Biochem Anal Biochem. 2017;6:308. doi: 10.4172/2161-1009.1000308. [DOI] [Google Scholar]
- Pandey VP, Singh S, Jaiswal N, et al. Papaya fruit ripening: ROS metabolism, gene cloning, characterization and molecular docking of peroxidase. J Mol Catal B Enzym. 2013;98:98–105. doi: 10.1016/j.molcatb.2013.10.005. [DOI] [Google Scholar]
- Saitou N, Nei M. The neighbor-joining method: a new method for reconstructing phylogenetic trees. Mol Biol Evol. 1987;4:406–425. doi: 10.1093/oxfordjournals.molbev.a040454. [DOI] [PubMed] [Google Scholar]
- Singh AK, Bilal M, Iqbal HMN, Raj A. In silico analytical toolset for predictive degradation and toxicity of hazardous pollutants in water sources. Chemosphere. 2022;292:133250. doi: 10.1016/j.chemosphere.2021.133250. [DOI] [PubMed] [Google Scholar]
- Singh AK, Katari SK, Umamaheswari A, Raj A. In silico exploration of lignin peroxidase for unraveling the degradation mechanism employing lignin model compounds. RSC Adv. 2021;11:14632–14653. doi: 10.1039/D0RA10840E. [DOI] [PMC free article] [PubMed] [Google Scholar]
- Singh I, Shah K. Evidences for structural basis of altered ascorbate peroxidase activity in cadmium-stressed rice plants exposed to jasmonate. Biometals. 2014;27:247–263. doi: 10.1007/s10534-014-9705-z. [DOI] [PubMed] [Google Scholar]
- Singh R, Bhardwaj VK, Das P, Purohit R. Identification of 11β-HSD1 inhibitors through enhanced sampling methods. Chem Commun. 2022;58:5005–5008. doi: 10.1039/D1CC06894F. [DOI] [PubMed] [Google Scholar]
- Singh R, Bhardwaj VK, Das P, Purohit R. New ecdysone receptor agonists: a computational approach for rational discovery of insecticides for crop protection. Mol Syst Des Eng. 2021;6:936–945. doi: 10.1039/D1ME00047K. [DOI] [Google Scholar]
- Singh R, Bhardwaj VK, Purohit R. Computational targeting of allosteric site of MEK1 by quinoline-based molecules. Cell Biochem Funct. 2022;40:481–490. doi: 10.1002/cbf.3709. [DOI] [PubMed] [Google Scholar]
- Singh R, Kumar S, Bhardwaj VK, Purohit R. Screening and reckoning of potential therapeutic agents against DprE1 protein of Mycobacterium tuberculosis. J Mol Liq. 2022;358:119101. doi: 10.1016/j.molliq.2022.119101. [DOI] [Google Scholar]
- Thiede B, Höhenwarter W, Krah A, et al. Peptide mass fingerprinting. Methods. 2005;35:237–247. doi: 10.1016/j.ymeth.2004.08.015. [DOI] [PubMed] [Google Scholar]
- Trott O, Olson AJ. AutoDock Vina: improving the speed and accuracy of docking with a new scoring function, efficient optimization, and multithreading. J Comput Chem. 2010;31:455–461. doi: 10.1002/jcc.21334. [DOI] [PMC free article] [PubMed] [Google Scholar]
- Veitch NC. Horseradish peroxidase: a modern view of a classic enzyme. Phytochemistry. 2004;65:249–259. doi: 10.1016/j.phytochem.2003.10.022. [DOI] [PubMed] [Google Scholar]
- Wallner B, Elofsson A. Can correct protein models be identified? Protein Sci. 2003;12:1073–1086. doi: 10.1110/ps.0236803. [DOI] [PMC free article] [PubMed] [Google Scholar]
- Webster J, Oxley D. Protein identification by MALDI-TOF mass spectrometry. In: Zanders Edward D., editor. Chemical genomics and proteomics. Totowa, NJ: Springer; 2012. pp. 227–240. [Google Scholar]
- Wiederstein M, Sippl MJ. ProSA-web: interactive web service for the recognition of errors in three-dimensional structures of proteins. Nucleic Acids Res. 2007;35:W407–W410. doi: 10.1093/nar/gkm290. [DOI] [PMC free article] [PubMed] [Google Scholar]
- Yadav M, Rai N, Yadav HS. The role of peroxidase in the enzymatic oxidation of phenolic compounds to quinones from Luffa aegyptiaca (gourd) fruit juice. Green Chem Lett Rev. 2017;10:154–161. doi: 10.1080/17518253.2017.1336575. [DOI] [Google Scholar]
- Yang J, Yan R, Roy A, et al. The I-TASSER Suite: protein structure and function prediction. Nat Methods. 2015;12:7–8. doi: 10.1038/nmeth.3213. [DOI] [PMC free article] [PubMed] [Google Scholar]
- Zhang L, Skolnick J. What should the Z-score of native protein structures be? Protein Sci. 1998;7:1201–1207. doi: 10.1002/pro.5560070515. [DOI] [PMC free article] [PubMed] [Google Scholar]
Associated Data
This section collects any data citations, data availability statements, or supplementary materials included in this article.
Supplementary Materials
Data Availability Statement
All data generated or analysed during this study are available within the article.