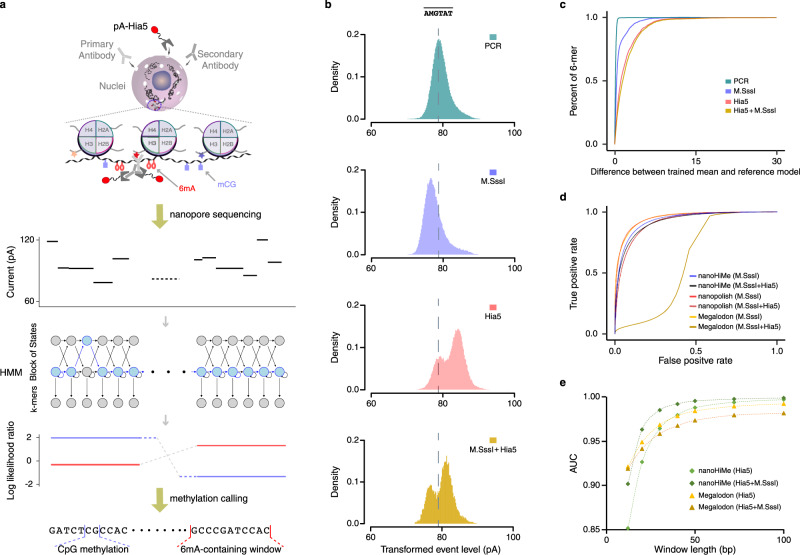
Fig. 1. Schematic and the performance of nanoHiMe-seq.
a The steps in nanoHiMe-seq. A primary antibody (light gray) binds to modified nucleosomes, a secondary antibody (medium gray) binds to the primary antibody, and both antibodies recruit the pA-Hia5 fusion protein (dark gray and red) to the targeted sites. The tethered pA-Hia5 methylates the adenines (6mAs; red oval) nearby. After sequencing, basecalling and alignment to the reference genome in base- and event-space, the likelihood of a sequence having or lacking modified base(s) is calculated for individual reads using a hidden Markov model. The ratio of the likelihood is used to identify methylated CpG sites (blue rectangle) and/or 6mA-containing sites. b Differences in the event distribution for a 6-mer with or without modified base(s). Nanopore sequencing data used to plot the event distribution of was from PCR amplicons without treatment (cyan), treated by M.SssI (blue), Hia5 (red) or both M.SssI and Hia5 (yellow). M indicates 5mC and represents a collection of k-mers derived from AMGTAT, but with 6mA at the first position, fifth position or both positions. c An overview of the differences between the reference models and the means of trained Gaussian using data from PCR amplicons without treatment (cyan), treated with M.SssI (blue), Hia5 (red), or both M.SssI and Hia5 (yellow). For 6-mers with more than one set of parameters, the mean with the most significant shift from the reference model was selected for the calculation. d Benchmarking of nanoHiMe, nanopolish and Megalodon for mCpG detection. A receiver operating characteristic (ROC) curve was used to assess the performance of different computational tools at calling CpG methylation on nanopore reads from PCR amplicons without treatment, treated by M.SssI, or both M.SssI and Hia5. e Assessment of the performance of nanoHiMe and Megalodon at identifying 6mA-containing sites of different lengths. The AUC was calculated based on the calls from nanoHiMe or Megalodon for each group of sites, and plotted as a function of the length of the sites. Source data are available in the Source Data file.

