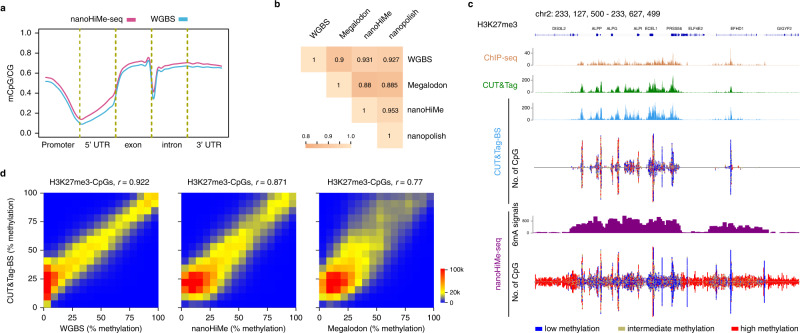
Fig. 3. nanoHiMe-seq for CpG methylation measurements.
a CpG methylation density revealed by nanoHiMe-seq (purple) and whole-genome bisulfite sequencing (WGBS; blue) throughout distinct gene-associated regions. b The performance of nanoHiMe, nanopolish, and Megalodon at calling CpG methylation from H3K27me3 nanoHiMe-seq data. The methylation levels of CpGs across the genome were calculated based on calls from nanoHiMe, nanopolish, or Megalodon from individual nanopore reads. The measurements from each of the three tools and from WGBS were compared, and the hierarchically clustered correlation matrix is shown. c View of H3K27me3 signals and CpG methylation status detected by nanoHiMe-seq and CUT&Tag-BS across a 500-kb segment of the human genome. The number of 6mA-containing sites identified by nanoHiMe-seq and the number of CpG sites covered by ≥5 nanoHiMe-seq and CUT&Tag-BS reads were counted and plotted in 1250-bp windows. The CpG sites were categorized into three groups: high methylation level (red, methylation ratio ≥ 70%), intermediate methylation level (yellow, 30% ≤ methylation ratio < 70%) or low methylation level (blue, methylation ratio < 30%). The top of the panel shows H3K27me3 signals from CUT&Tag and ChIP-seq. d Comparison of CpG methylation levels determined by CUT&Tag-BS to those measured by WGBS, nanoHiMe or Megalodon at H3K27me3-marked regions. The x-axis is the methylation percentage of individual CpGs calculated from WGBS (left), or calculated based on the calls from nanoHiMe (middle) or Megalodon (right). The y-axis denotes the methylation percentage measured by CUT&Tag-BS. The CpG sites covered by ≥20 reads from both assays were selected for the analysis. Source data are available in the Source Data file.

