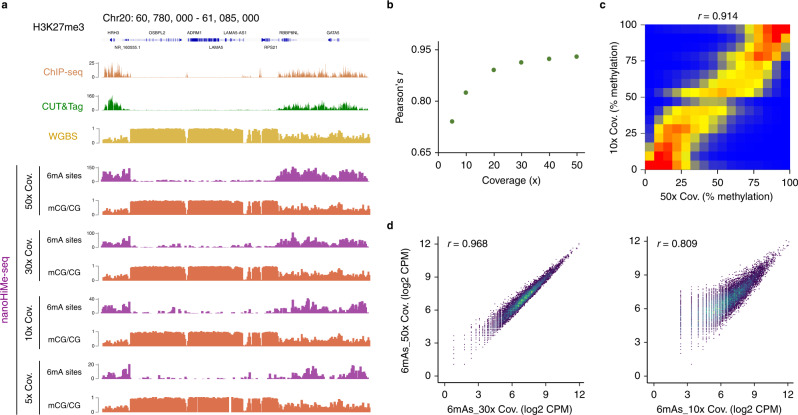
Fig. 4. nanoHiMe-seq requires fewer sequencing reads.
a View of 6mA signals and CpG methylation density for 50×, 30×, 10× and 5× coverage depths. The 6mA-containing sites identified using an LLR cut-off of 32 were counted in 1000-bp bins. The top of the panel shows H3K27me3 signals from CUT&Tag and ChIP-seq, as well as CpG methylation density measured by WGBS. b Pearson’s correlation coefficients for the comparison between CpG methylation levels measured by nanoHiMe-seq with various coverage depths and measurements from WGBS. c Comparison of CpG methylation levels measured by nanoHiMe-seq from 50× and 10× coverage depths. d Density scatterplots showing the correlation between 6mA signals for 50× and 30× (left) or 10× (right) coverage depths. Each dot represents an individual peak, and the numbers of 6mA-containing sites in individual peaks were normalized as counts per million reads (CPM). Pearson’s correlation coefficient is shown at the top of each plot. Source data are available in the Source Data file.

