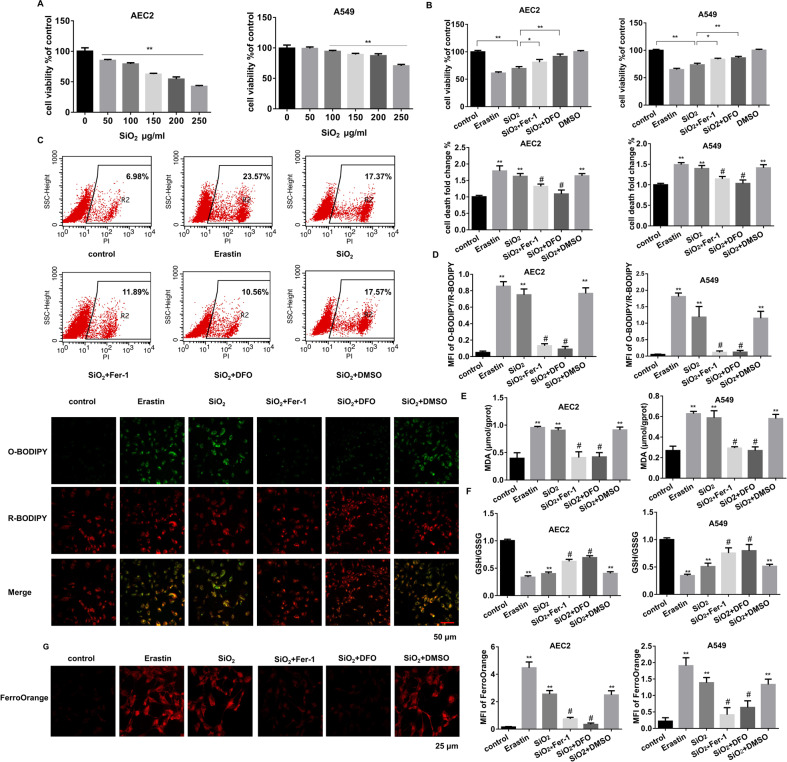
Fig. 2. AEC2s undergo ferroptosis upon SiO2 stimulation.
A CCK8 detected mouse primary AEC2 and A549 cell viability after treated with 0, 50, 100, 150, 200, and 250 μg/mL SiO2 for 24 h (**P < 0.01). Then AEC2 and A549 cells were treated with 1 μM erastin, 150 or 250 µg/mL SiO2 individually, SiO2 with 1 μM Fer-1, SiO2 with 100 μM DFO, and DMSO for 24 h. CCK8 (B), flow cytometry representative pictures of primary AEC2 and quantification results of both primary AEC2 and A549 cells (C) were shown. D Representative images of C11-BODIPY in treated-primary AEC cells (red: reduced C11-BODIPY, green: oxidized C11-BODIPY; scale bars, 50 µm; lower panel), and quantification of C11-BODIPY fluorescence in primary AEC2 and A549 cells (upper panel). E MDA concentration in cell lysates from primary AEC2 and A549 cells was measured using a Lipid Peroxidation MDA Assay Kit. F GSH/GSSG ratio of primary AEC2 and A549 cells. G Intracellular Fe2+ was detected with the FerroOrange probe, and representative images of primary AEC2 cells were shown (red: FerroOrange-stained Fe2+; scale bars, 25 µm; left panel). Fe2+ fluorescence intensity was quantified by ImageJ in both primary AEC2 and A549 cells (right panel). *P < 0.05, **P < 0.01 versus control group, #P < 0.01 versus SiO2 + DMSO treated group.

