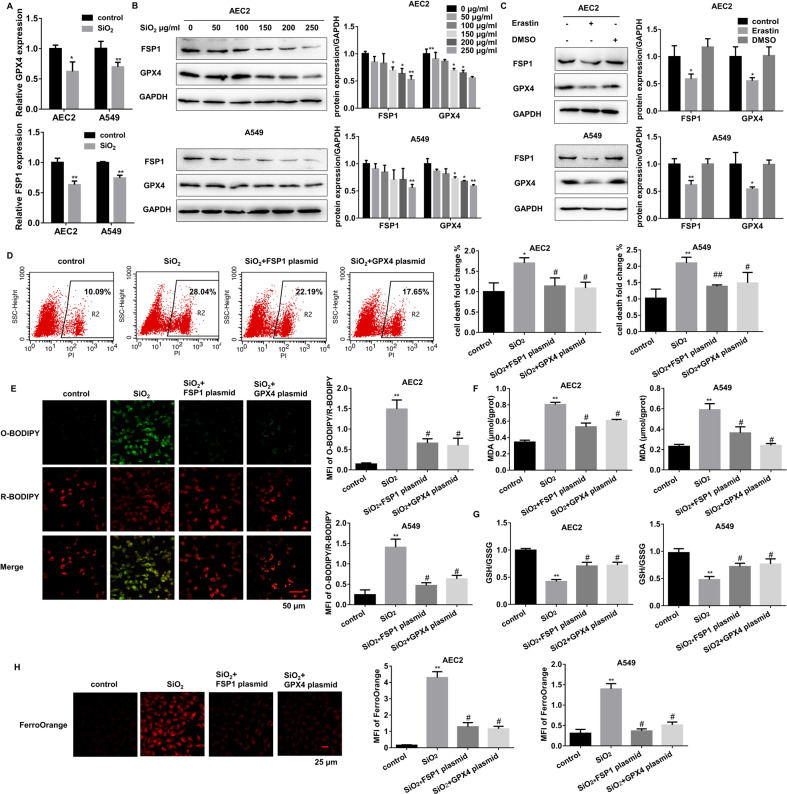
Fig. 3. GPX4 cooperates with FSP1 to regulate SiO2-induced AEC2 ferroptosis.
A mRNA levels of GPX4 and FSP1 were measured in 150 µg/mL SiO2 treated primary AEC and 250 µg/mL SiO2 treated A549 cells (*P < 0.05 versus control group, **P < 0.01 versus control group). B Representative immunoblotting of GPX4 and FSP1 in 0, 50, 100, 150, 200, and 250 µg/mL SiO2 treated primary AEC2 and A549 cells (left panel), means ± SEM of three independent experiments (right) are shown. C Mouse primary AEC2 and A549 cells were treated with 1 μM erastin or DMSO, representative immunoblotting of GPX4 and FSP1 (left), as well as means ± SEM of three independent experiments (right) are shown. Then AEC2 and A549 cells were treated with 150 or 250 µg/mL SiO2 individually, SiO2 with FSP1 plasmid, and SiO2 with GPX4 plasmid. D Flow cytometry representative pictures of primary AEC2 and quantification results of both primary AEC2 and A549 cells. E Representative images of C11-BODIPY in treated-primary AEC cells (red: reduced C11-BODIPY, green: oxidized C11-BODIPY; scale bars, 50 µm; left panel), and quantification of C11-BODIPY fluorescence in primary AEC2 and A549 cells (right panel). F MDA concentration in cell lysates from primary AEC2 and A549 cells was measured using a Lipid Peroxidation MDA Assay Kit. G GSH/GSSG ratio of primary AEC2 and A549 cells. H Intracellular Fe2+ was detected with the FerroOrange probe, and representative images of primary AEC2 cells were shown (red: FerroOrange-stained Fe2+; scale bars, 25 µm; left panel). Fe2+ fluorescence intensity was quantified by ImageJ in both primary AEC2 and A549 cells (right panel). **P < 0.01 versus control group, #P < 0.01 versus SiO2-treated group.

